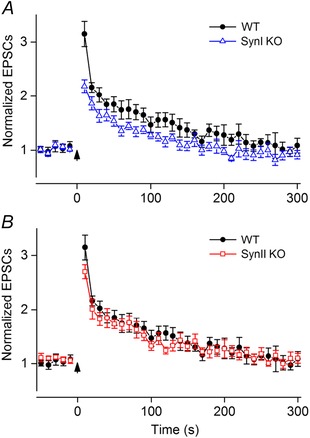
Figure 5. Post‐tetanic potentiation .

A, comparisons between neurons from SynI KO (n = 11) and WT mice (n = 11) (means ± SEM). The maximum PTP (responses to the first test stimuli) in SynI KO was smaller than in WT (P = 0.001). B, comparisons between neurons from SynII KO (n = 10) and WT mice (n = 11). No differences between SynII KO and WT were observed (P > 0.05). A tetanic pulse train, 100 pulses at 100 Hz, started at t = 0 (see arrow). Before the pulse train, responses to a series of control pulses at 0.1 Hz were recorded (only last five shown). Ten seconds after the train, responses to test pulses at 0.1 Hz were recorded. Notice that the data for the WT are the same in A and B. The amplitude of the EPSCs to single pulse stimulation: −60 ± 8 pA (WT), −58 ± 8 pA (SynI KO), −47 ± 5 pA (SynII KO).
