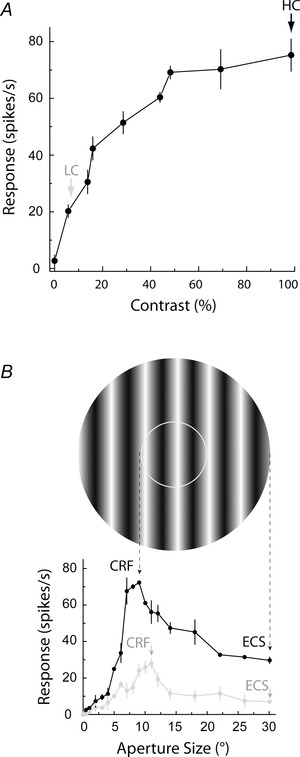
Figure 1. Identification of the classical receptive field (CRF) and extraclassical surround (ECS) at high and low contrast .

A, for this example neuron, 100% contrast elicits the maximum response (black arrow) and is chosen as the high contrast (HC). The percentage contrast eliciting 30% of the maximum response is 8% (grey arrow) and is chosen as the low contrast (LC). B, the aperture tuning curves for the same neuron at high (black trace) and low (grey trace) contrast are shown. The grating stimulus shown above corresponds to the high contrast CRF (inner white circle) and the high contrast ECS (outer edge of the whole aperture), with dashed arrows pointing to the corresponding peak response at 9 deg and the point of subsequent maximum suppression at 30 deg. The representative low contrast grating stimulus is not shown, but the CRF size is slightly larger, 11 deg (left grey arrowhead), as indicated by the rightward shift of the peak response of the grey tuning curve. The low contrast ECS is 30 deg (right grey arrowhead), since this is the point of maximum suppression following the peak.
