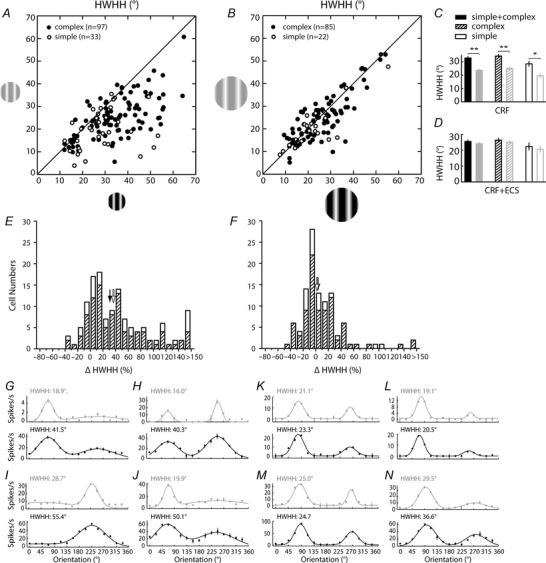
Figure 3. Orientation tuning width for the V1 cell population broadens when contrast is increased for CRF stimuli, but is invariant to contrast when the ECS is included .

Scatter plots show the relationship between the HWHH at low (y‐axis) and high (x‐axis) contrast for the CRF (A) and CRF + ECS (B) conditions. The 105 neurons shown in B are a subset of the 130 neurons shown in A. Complex and simple cells are shown as black and white filled circles, respectively. To facilitate comparisons, resulting means from the scatter plots are presented in the bar graphs in C and D; black bars represent high contrast, grey bars represent low contrast. Error bars show the standard error of the mean. Single and double asterisks indicate significance at P = 0.001 and P < 0.0001, respectively. For all cell types (filled bars), and for complex (hatched bars) and simple (open bars) cells independently, the HWHH increases significantly when contrast is increased from low to high for the CRF (C), but does not change significantly for the CRF + ECS (D). Histograms in E and F show the percentage change in HWHH at high and low contrasts for the populations of cells shown in A and B. Hatched and open bars represent complex and simple cell counts, respectively. Positive percentage change values indicate that HWHH is broader at high compared to low contrast, whereas negative values indicate the HWHH is narrower at high contrast. Black and white arrows indicate the medians for complex and simple cells, respectively. Orientation tuning curves are shown for eight example neurons, four (G–J) corresponding to the CRF conditions plotted in A, and four (K–N) corresponding to the CRF + ECS conditions plotted in B; grey traces (top) represent low contrast and black traces (bottom) represent high contrast.
