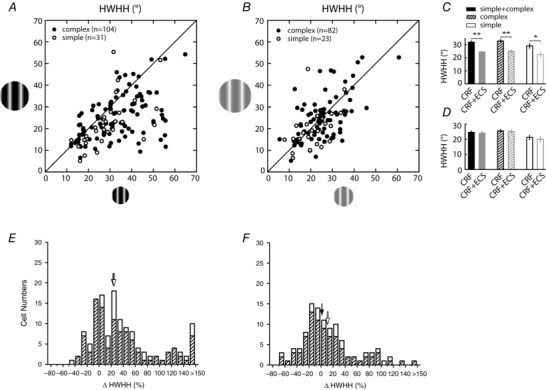
Figure 4. Contrast‐invariant orientation tuning can be attributed to the inclusion of the ECS at high contrast .

Scatter plots show the relationship between the HWHH for the CRF (x‐axis) and CRF + ECS (y‐axis) stimuli at high (A) and low (B) contrast. The 105 neurons shown in B are a subset of the 135 neurons shown in A. To facilitate comparisons, resulting means from the scatter plots are presented in the bar graphs in C and D. Histograms in E and F show the percentage change in HWHH at high and low contrasts for the populations of cells shown in A and B. Other conventions are the same as in Fig. 3. Single and double asterisks indicate significance at P = 0.009 and P < 0.0001, respectively. The addition of the ECS leads to a highly significant decrease in HWHH for high contrast stimuli; whereas at low contrast there is no net change in HWHH for the population.
