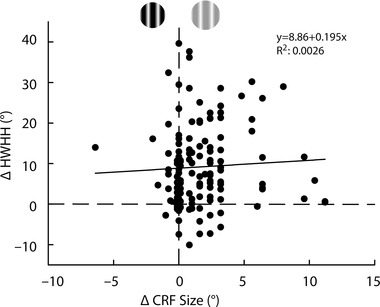
Figure 5. Change in CRF size does not account for contrast variance .

For the 130 cells in Fig. 3 A we plotted change in CRF size between high and low contrast conditions (x‐axis) against change in HWHH (y‐axis). For 40 cells there was no change in CRF size due to contrast (plotted along the vertical dashed line). An additional 10 cells had CRF sizes at high contrast that were larger than at low contrast (negative values on the x‐axis). The remaining 80 neurons showed an increase in CRF size at low contrast (positive values on the x‐axis). Overall, increase in HWHH at high contrast (positive values on the y‐axis) occurs regardless of change in CRF size (R 2 = 0.0026), resulting in little correlation (r = 0.05) as indicated by the trend line.
