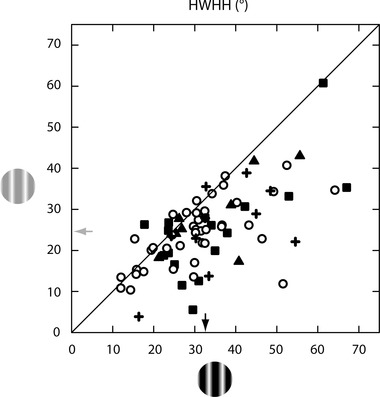
Figure 6. Contrast variance of orientation tuning remains when controlling for low contrast CRF expansion .

The scatter plot shows the relationship between HWHH at low (y‐axis) and high (x‐axis) contrast for the CRF condition in a subset of 75 of the 130 neurons shown in Fig. 3 A. For 50 neurons, the values are the same as given in Fig. 3 A which include 40 cells where the CRF sizes are the same at both contrasts (circles), and 10 cells where the CRF is larger at high than at low contrast (+ symbols). For the remaining 25 neurons, HWHH values were recalculated for one of the two contrast conditions where either the high contrast size was increased to match that of the low contrast CRF size (n = 17; squares) or the low contrast size was reduced to match that of the high contrast CRF size (n = 8; triangles). Under these stimulus conditions the average low contrast size is equivalent to (n = 65) or smaller than (n = 10) the average high contrast size, and there is a highly statistically significant change in mean HWHH (indicated by arrows) between the two contrasts (24.8 ± 1.1 deg at low contrast; 32.7 ± 1.4 deg at high contrast; P < 0.0001).
