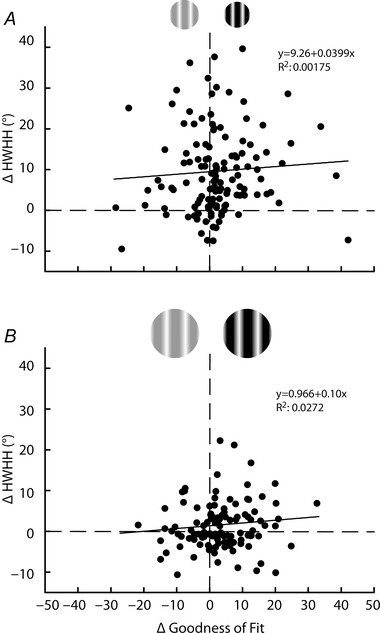
Figure 7. Contrast variance of orientation tuning does not strongly correlate with variation in goodness of fit .

Change in HWHH between high and low contrast (y‐axis) for the CRF (A) and CRF + ECS (B) conditions are plotted against the change in the goodness of fit (R 2 × 100) for high and low contrast (x‐axis). Positive values on the x‐axis indicate better fits at high contrast; positive values on the y‐axis indicate broader tuning width at high contrast. Dashed lines indicate zero change for each axis. Change in the goodness of fit accounts for very little of the contrast variance (R 2 = 0.00175 in A; R 2 = 0.0272 in B). Trend lines are also provided and indicate little correlation (see Results).
