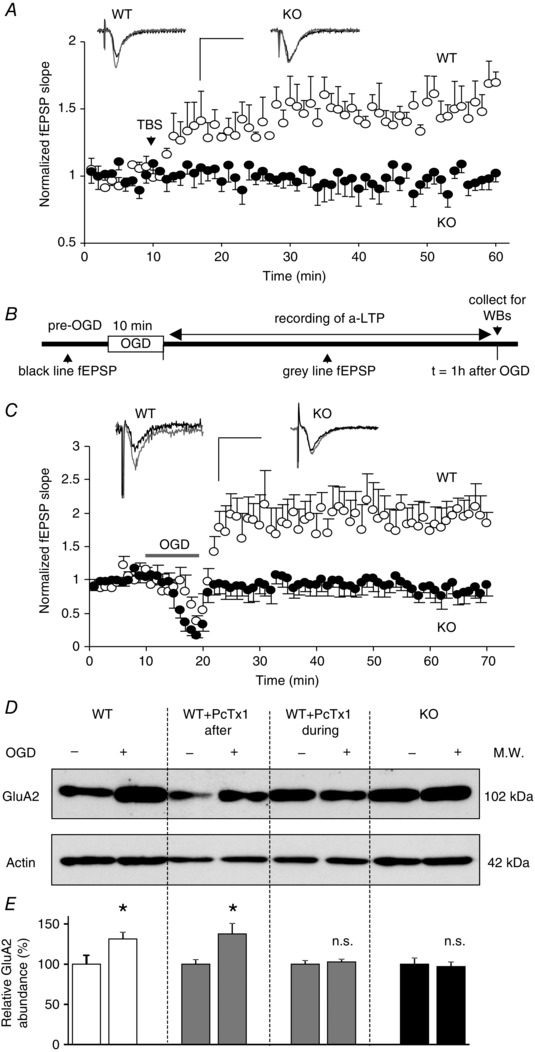
Figure 1. Anoxic LTP relies on ASIC1a in OHSCs .

A, theta‐burst stimulation (TBS) induced changes in the slope of AMPAR‐mediated fEPSPs measured in the CA1 stratum radiatum of OHSCs from WT (○, n = 4) and ASIC1a KO (●, n = 5) mice. Inset: representative baseline (black trace) and 30 min after TBS (grey trace) recordings; Scale bars: 25 ms and 1 mV. B, experimental protocol for a‐LTP experiments. C, changes of fEPSP slope induced by 10 min OGD in WT (○, n = 3) and ASIC1a KO (●, n = 4) OHSCs. The increase in slope observed in WT corresponds to a‐LTP. Inset: representative traces before (black trace) and 30 min after OGD (grey trace). Scale bars: 25 ms and 1 mV. D, representative Western blots showing changes in GluA2 subunit expression 1 h after OGD. OHSCs from WT or ASIC1a KO animals were exposed either to control (−) or to OGD (+) conditions. Some WT slices were treated with psalmotoxin 1 (PcTx1, 100 nm) during or after OGD; actin was used for normalization. E, relative GluA2 subunit abundance compared with controls expressed as a percentage (n = 6–14). Error bars, SEM; *P < 0.05; n.s., not significant.
