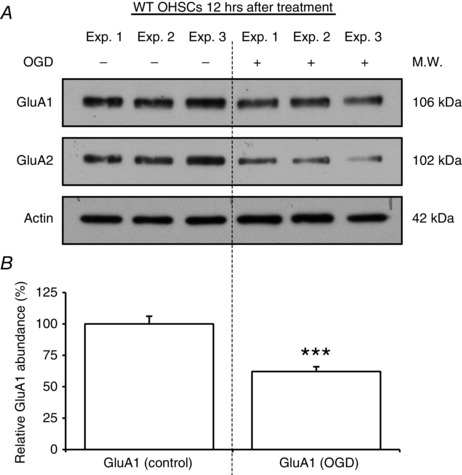
Figure 3. GluA1 subunit is downregulated in OHSCs exposed to OGD .

A and B, changes in GluA1 subunit expression 12 h after OGD treatment. OHSCs from WT animals were exposed either to control (−) or to OGD (+) conditions. A, Western blots, obtained for GluA1 subunits, GluA2 subunits and actin (for normalization) in three representative experiments (Exp. 1–3). B, relative GluA1 abundance, compared with controls expressed in percentage (n = 8). GluA1 subunit abundance decreases in a similar way to GluA2 in total protein extracts of OHSCs. Error bars, SEM; ***P < 0.0005.
