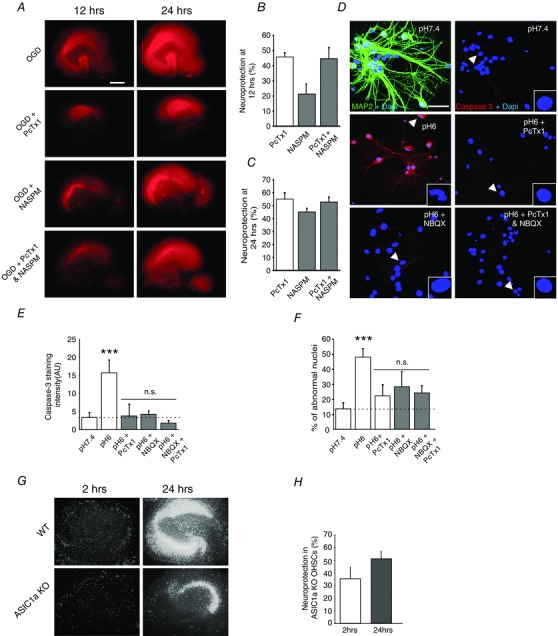
Figure 6. Combining ASIC1a and CP‐AMPAR inhibitors does not provide further neuroprotection against ischaemia or acidosis .

A, evaluation of OGD‐induced degeneration in organotypic cultures with propidium iodide (PI) uptake quantification. Representative pictures of PI uptake in slices at 12 and 24 h after OGD. Scale bar = 250 μm. WT slices exposed to OGD were treated for the first 6 h with either saline (control), PcTx1 (100 nm), NASPM (100 μm) or both inhibitors together. B and C, quantification of the neuroprotection by ion channel inhibitors in the CA1 region at 12 and 24 h after OGD. The percentage of neuroprotection was calculated as detailed in Methods (n = 3 cultures, number of slices/condition = 6–12). D, confocal images of hippocampal pyramidal cells 24 h after a 15 min treatment with pH 7.4, pH 6.0, pH6.0 + PcTx1 (20 nm, during pH 6.0), pH 6.0 + NBQX (10 μm, after pH 6.0), or pH 6.0 + PcTx1 and NBQX together. Top left, double staining for MAP2 (green) and DAPI (blue) confirms the purity of HPN cultures. Other pictures, neuronal injury and death in HPN cultures assessed with caspase‐3 cleaved form staining (red) and the percentage of abnormal nuclei (stained in blue with DAPI) as markers. Scale bar = 25 μm. Typical nuclei are indicated by an arrowhead and represented at high magnification in the right bottom corner. E and F, quantification of the cleaved caspase‐3 signal, and of the percentage of abnormal nuclei. G, representative images of propidium iodide uptake in hippocampal slices from WT and ASIC1a knockout at 2 and 24 h after OGD. H, pooled data showing the protective effect of ASIC1a knockout on OGD mediated cell death (n = 4). Error bars, SEM; *P < 0.05, **P < 0.005, ***P < 0.0005 vs. pH 7.4; n.s., not significant.
