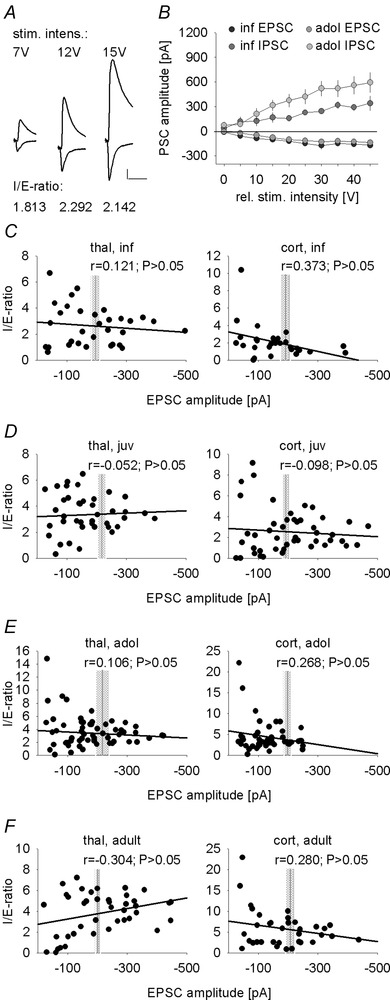
Figure 4. Input–output curves and inhibition/excitation ratios across different EPSC amplitudes .

A, example traces of thalamic fibre evoked EPSCs (at −65 mV) and IPSCs (at 0 mV) in a representative LA principal at different stimulation intensities, demonstrating similar I/E ratios for different stimulation intensities. Scale bar: 100 pA, 20 ms. B, mean evoked EPSC and IPSC amplitudes upon thalamic input stimulation across different stimulus intensities in infant and adolescent mice (infant: n = 8 cells; adolescent: n = 11 cells). C–F, scatter plots of I/E ratios across EPSC amplitudes evoked by either thalamic (left) or cortical (right) presynaptic fibre stimulation in infant (A, n = 8 cells), juvenile (B, n = 10), adolescent (C, n = 13) and adult (D, n = 7) mice. Vertical grey lines and shaded areas represent the means ± SEM of EPSC amplitudes obtained from Fig. 3 for comparison.
