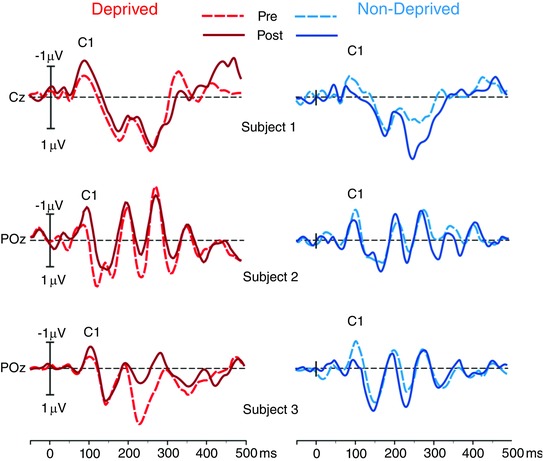
Figure 1. Averaged event‐related potential (ERP) waveforms from three representative subjects .

The electrodes where the individual C1 amplitude showed the maximum peak are displayed. The waveforms from the pre‐ (dotted lines) and post‐ (continuous lines) deprivation are superimposed for the deprived (red lines, left panel) and non‐deprived (blue lines, right panel) eye.
