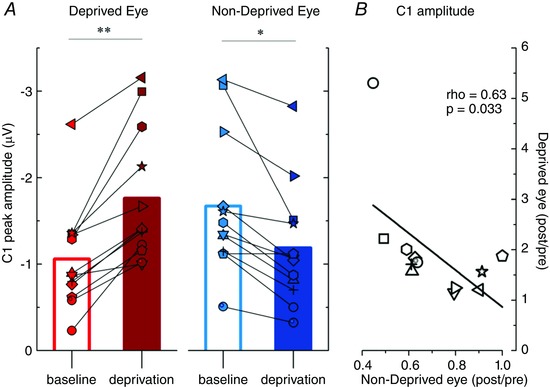
Figure 2. C1 component peak analysis .

The average and the individual observers’ peak amplitudes of the C1 component recorded before and after deprivation are plotted for the deprived (A, red symbols) and non‐deprived eye (B, blue symbols). Peak C1 amplitudes recorded before and after deprivation are statistically different both for the deprived and non‐deprived eye (*P < 0.05, **P < 0.01). C, the individual ratios between C1 peak amplitude acquired post‐ and pre‐deprivation for the deprived and non‐deprived eye are plotted against each other, the change in peak amplitude for the deprived and non‐deprived eye strongly correlates across subjects.
