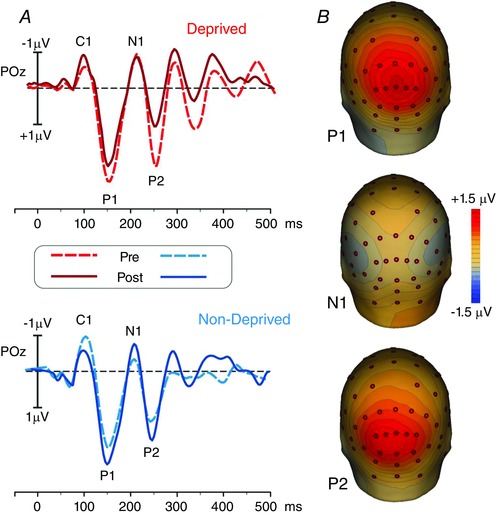
Figure 4. Average P1, N1 and P2 waveforms and topography .

A, grand average (from −50 to 500 ms) of the VEP waveforms on the parietal–occipital (POz) site, where the considered components showed the maximum peak. The waveforms from the pre‐ (dotted lines) and post‐ (continuous lines) deprivation experimental sessions are superimposed for the deprived (red lines, top panel) and non‐deprived (blue lines, bottom panel) eye. The components are labelled in the figures. B, topographical maps of the VEP components: P1, top; N1, middle; P2, bottom. Please note that the maps are obtained by collapsing all the data, since no differences can be appreciated in the topography across eye and time.
