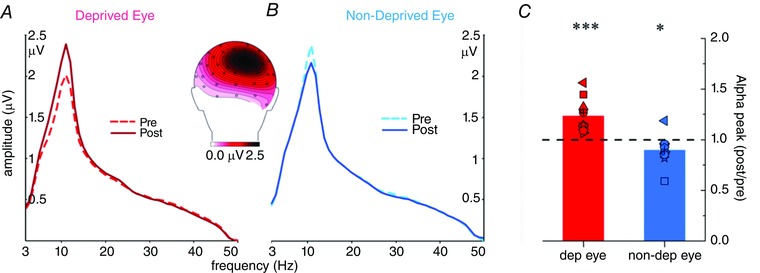
Figure 5. Alpha peak activity amplitude analysis .

Amplitude spectra of the grand‐averaged (300–700 ms after stimulus onset) ERPs from the pre‐ (continuous lines) and post‐ (dotted lines) deprivation are superimposed for the deprived (red lines, A) and non‐deprived (blue lines, B) eye in the 3–50 Hz frequency range. The main peak falls within the alpha frequency range (around 10 Hz). The topographical map (back view) of the alpha peak is shown at the centre of the figure to provide evidence of its spatial localization. C, bar plot of the differences in the amplitude of the alpha peak between post‐ and pre‐deprivation for the deprived (red bar) and non‐deprived (blue bar) eye (***P < 0.001, *P < 0.05).
