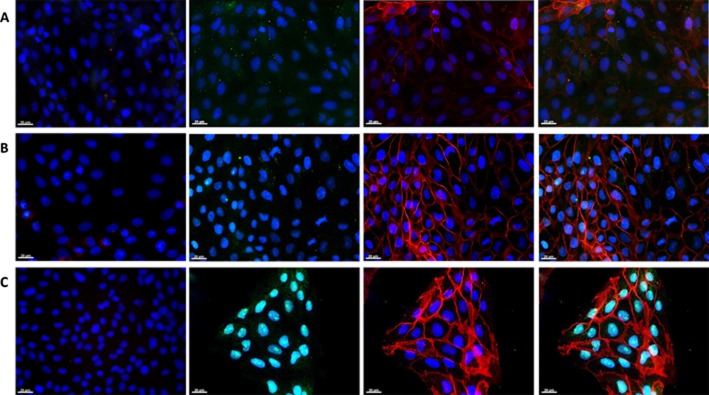
Figure 2.

Immunofluorescence of CB1 and CB2 receptors, and TRPV1 channels. In all the panels, cell nuclei are marked in blue (DAPI), cannabinoid receptors are in green (Alexa 488) and Na+/K+-ATPase in red (Alexa 594). Rows are as follows (A) CB1, (B) CB2 and (C) TRPV1. Columns are as follows: first column is the negative control (no primary antibody incubation); the second shows the expression of each studied receptor; the third presents the Na+/K+-ATPase distribution; and the fourth is the merged image of each receptor (green) and Na+/K+-ATPase (red). Representative images from three different immunofluorescence assays for each receptor. Magnification 40×.
