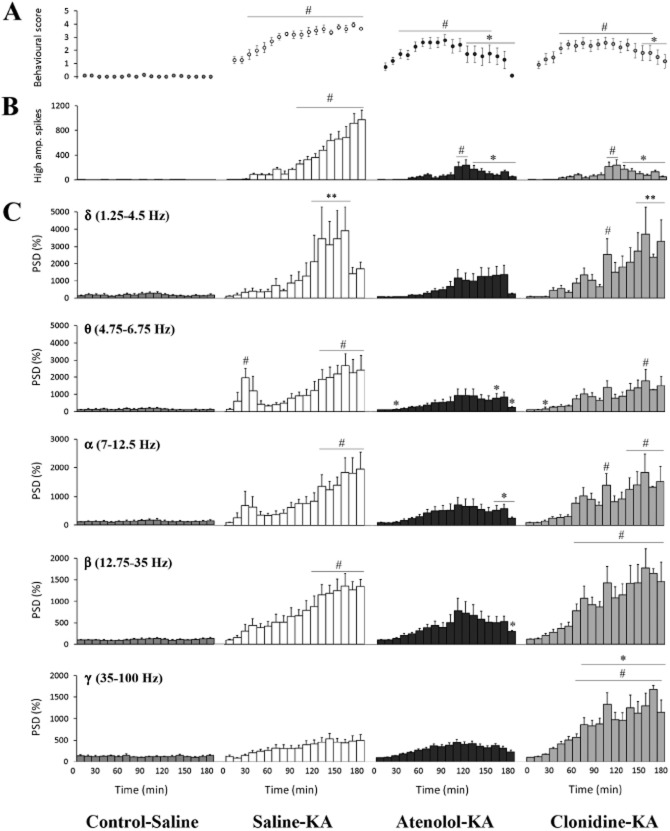
Figure 2.
EEG and behavioural changes following seizure induction with KA over 180 min. (A) Mean behavioural score (mean ± SEM; n = 8) every 10 min. (B) Number of high amplitude EEG spikes (mean ± SEM) in a 10 min bin. (C) Power spectral density (PSD): Histograms represent normalized PSD (mean ± SEM; n = 8) for each 10 min bin across the δ (1.25–4.5 Hz), θ (4.75–6.75 Hz), α (7.0–12.5 Hz), β (12.75–35.0 Hz) and γ (35.0–100 Hz) frequency bands. #P < 0.05 compared with Control-Saline. *P < 0.05 compared with Saline-KA; Kruskal–Wallis, with Bonferroni test.

