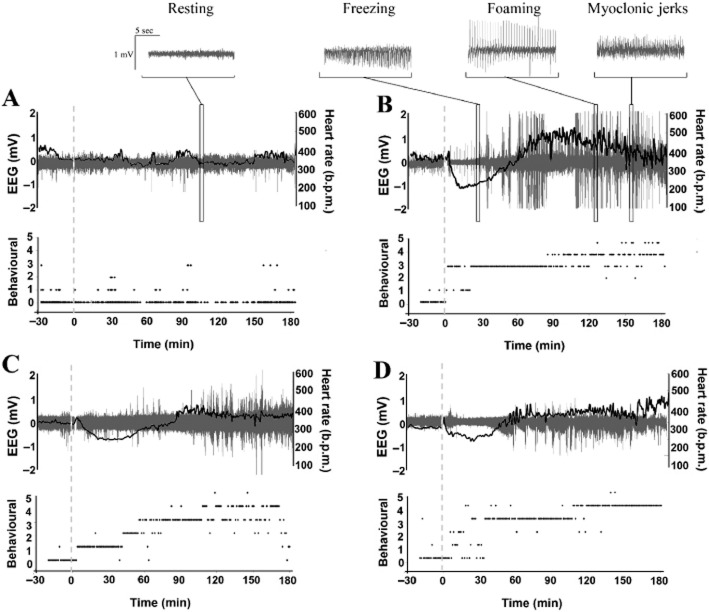
Figure 3.
Time course of ECG, EEG and behavioural changes during seizure induction. (A–D) Representative traces showing combined HR (b.p.m.; black line trace), EEG activity (mV; grey spectral trace) and behavioural score responses in individual Control-Saline (A), Saline-KA (B), Atenolol-KA (C) and Clonidine-KA (D) rats following saline vehicle or KA (dashed line) administration.

