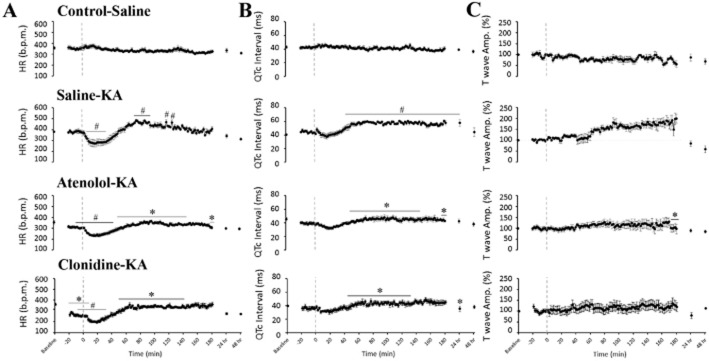
Figure 4.

Effects of atenolol and clonidine pretreatment on ECG changes. The figure shows the individual group responses (mean ± SEM; n = 8 per group) to treatment in (A) HR (b.p.m.); (B) corrected QT interval in seconds (QTc = QT/(RR/100)1/2); and (C) T wave elevation (normalized to baseline) over a 48 h recording period following seizure induction with KA (indicated using a dashed line). Significance is expressed against the corresponding time point; #P < 0.05 compared with Control-Saline, *P < 0.05 compared with Saline-KA; two-way repeated measures anova with Bonferroni test
