Figure 7.
Persistent sodium currents
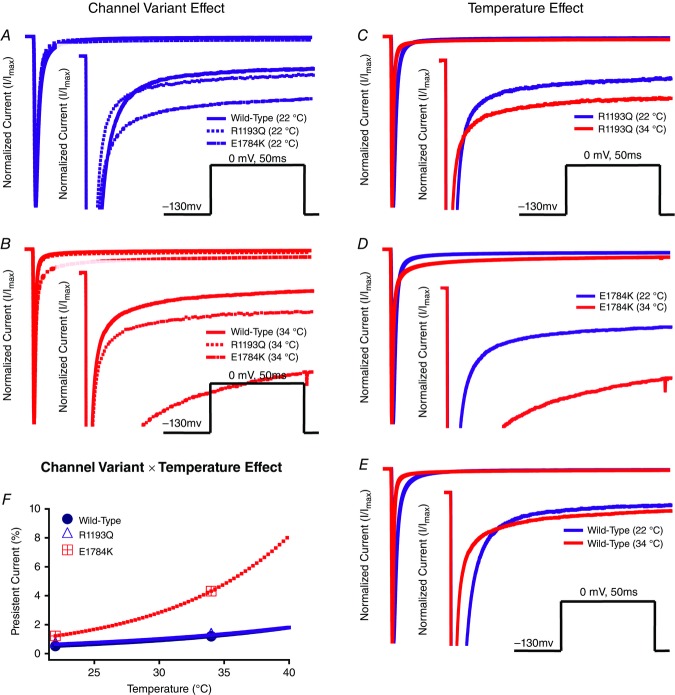
Panels A–F show normalized current plotted as a function of time with insets that focus on a narrower current window to show persistent INa. Panels A and B show the channel variant effect at both 22°C and 34°C. Panels C and D show the temperature effect for WT, R1193Q and E1784K. The pulse protocol inset is not shown in Panel E for clarity purposes. Panel F shows the Q10 fit for persistent current of all the channel variants plotted as a function of temperature.

