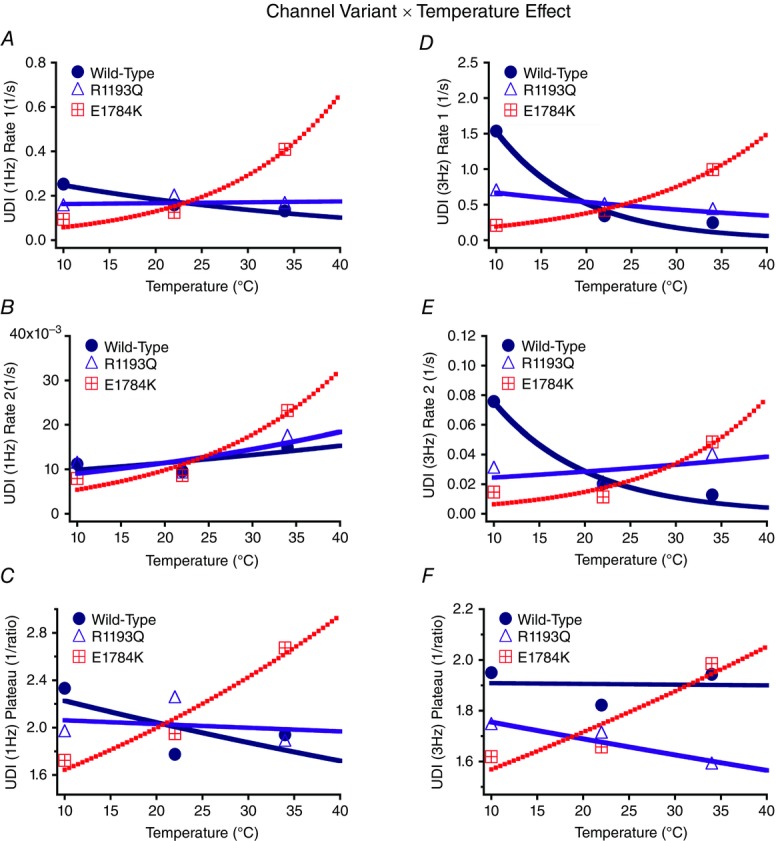
Figure 10.

Use-dependent inactivation (UDI; 1 Hz and 3 Hz) parameters Q10 fits
Panels A and D show the initial rate of use-dependent inactivation for 1 Hz and 3 Hz, respectively. Panels B and E show the secondary rate of use-dependent inactivation for 1 Hz and 3 Hz, respectively. Panels C and F show the inverse of plateau of use-dependent inactivation for 1 Hz and 3 Hz, respectively.
