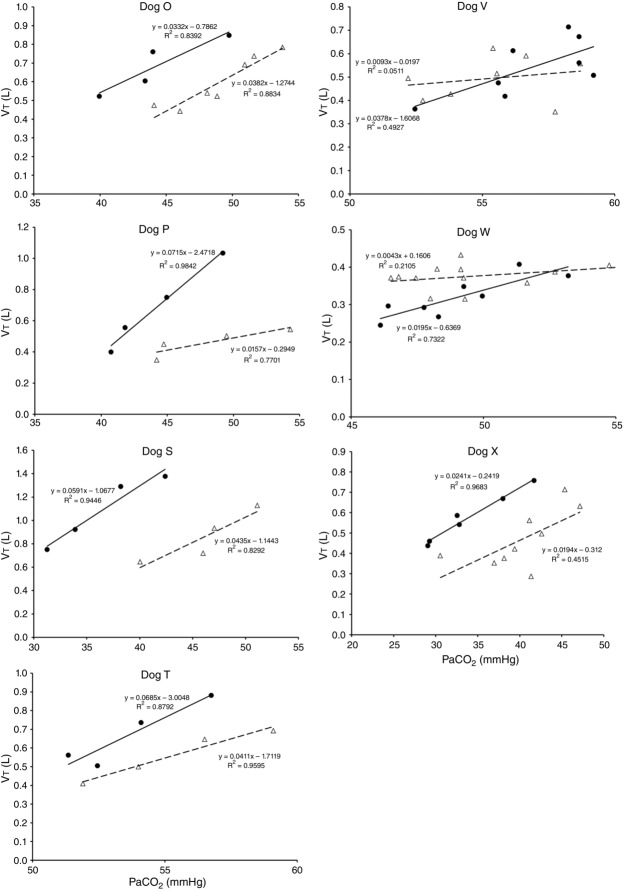
Figure 5.
Ventilatory responses of VT to increased Fico2 during CB hypercapnic and CB hypocapnic perfusion for each of the seven dogs
Regression equations and r2 values are adjacent to the regression line they pertain to (See text for details). Symbols as in Figure 4.

