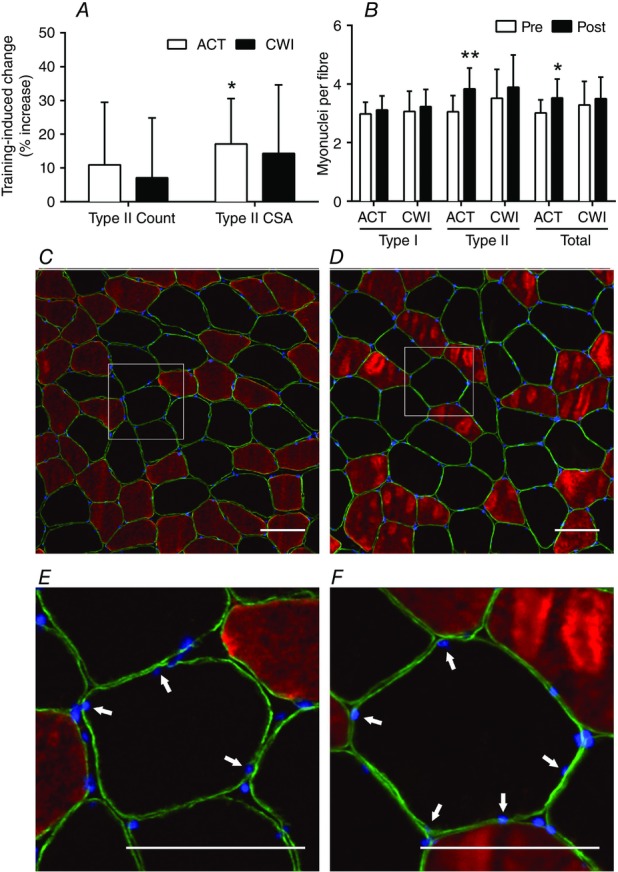
Figure 2.

Change in type II muscle fibre count, myofibre cross-sectional area and myonuclear accretion
A and B, main effects for time existed for type II fibre cross-sectional area (P = 0.004) (A) and myonuclear accretion (type II, P < 0.001; and total, P = 0.002) (B). **P < 0.001 and *P < 0.05 change following training. C–F, representative pre-training (C and E) and post-training (D and F) images from the same participant. Type I fibres stain red, nuclei stain blue, and type II fibres are unstained. The dystrophin labelled muscle fibre membrane stains far-red but is pseudo-coloured green for presentation. Myonuclei were identified as nuclei within dystrophin rings (E and F; highlighted by arrows). Scale bars = 100 μm.
