
Figure 8.
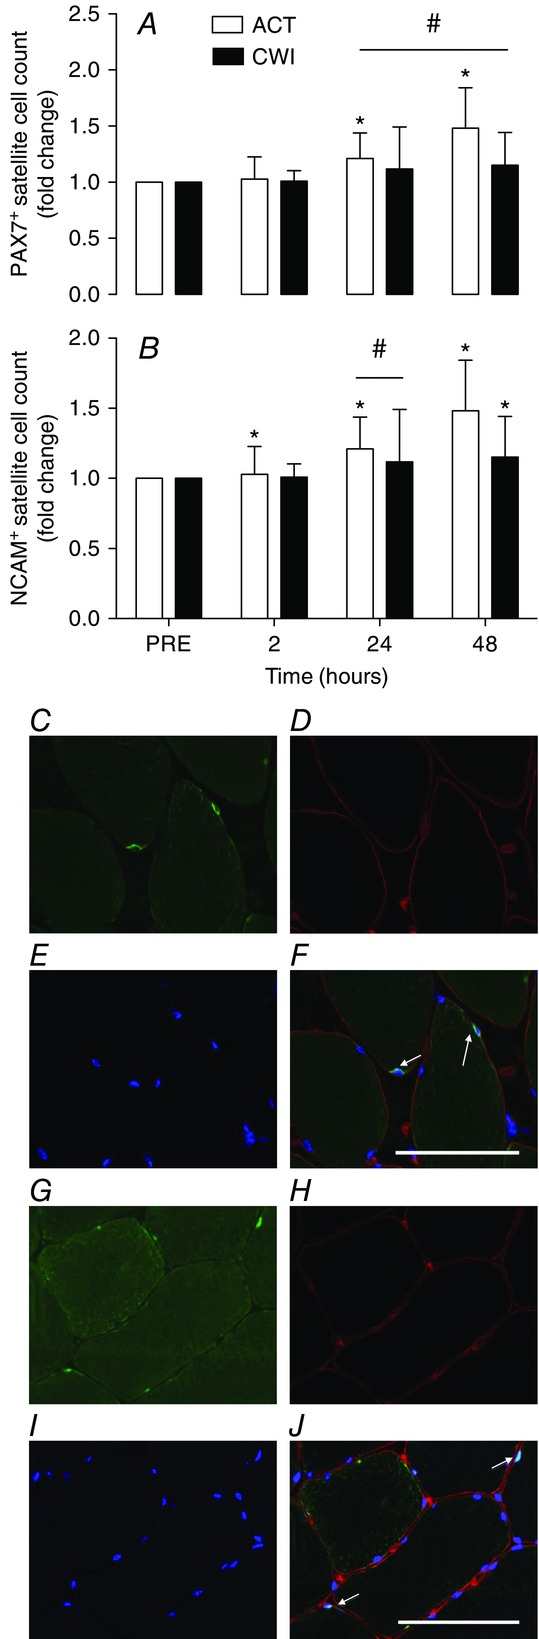
Change in Pax7+ (A) and NCAM+ (B) satellite cell numbers
Main effects existed for Pax7+ cells (time P = 0.008; time × trial P = 0.038) and NCAM+ cells (time P = 0.025; time × trial P = 0.002). *P < 0.05 change from PRE. #P < 0.05 difference between groups. Representative images 2 h post-exercise from the ACT leg (Study 2) showing NCAM or Pax7 (C and G; bright green), laminin (D and H; red), DAPI staining of nuclei (E and I; blue) and merged images (F and J). Satellite cells were identified as nuclei within laminin rings, with overlapping NCAM (F; highlighted by arrows) or Pax7 staining. White arrows indicate NCAM+ or Pax7+ cells. Scale bar = 50 μm.