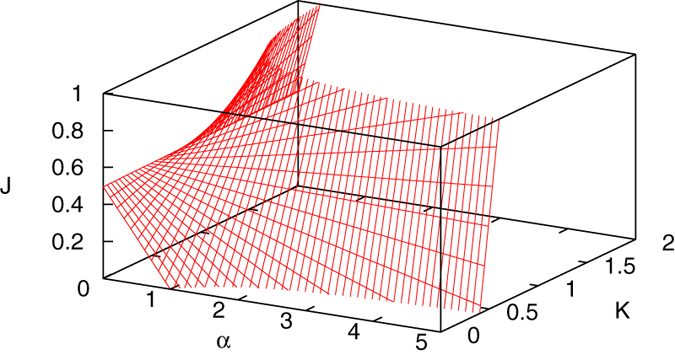
Figure 2. Effective cooperation level in a two-state approximation of the three-state model.

The shaded surface represents J(α, K) in Eq. (20) for values of J limited to the region [0, 1]. Consensus is possible when J > 1. The curve formed by the intersection of J(α, K) with the J = 1 plane marks the phase transition boundary defined in Eq. (17) and Eq. (18).
