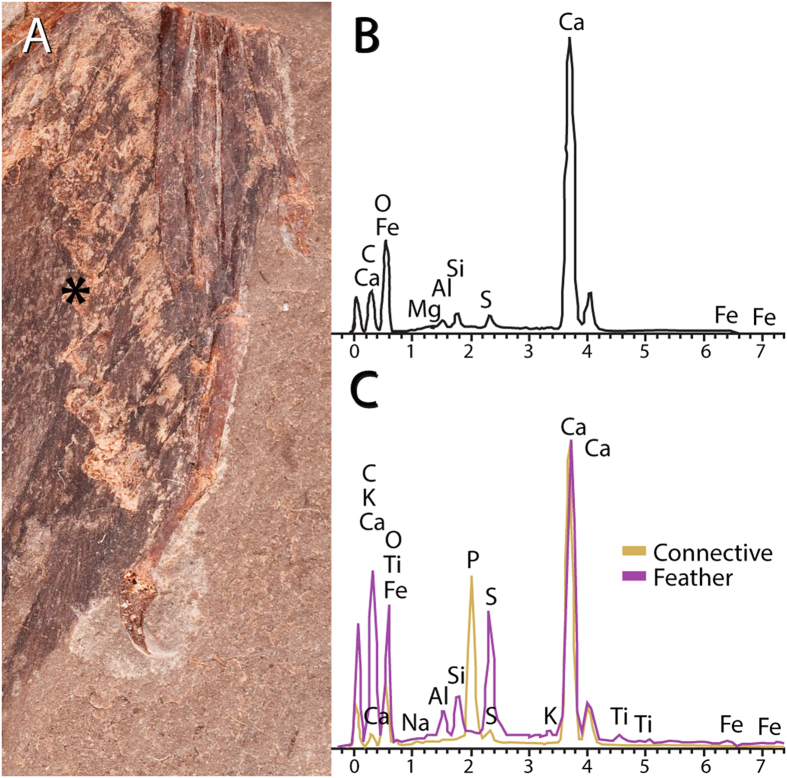
Figure 4. EDAX data from different regions of the slab of MCCMLH31444.
(A) Photograph of part of MCCMLH31444 indicating the region (asterisk) where the EDAX analysis was performed (over the remains of connective tissue). (B) EDAX profile of matrix, primarily showing a high abundance of Ca as expected for a limestone locality. (C) EDAX profile of feathers (purple profile) and connective tissues (brownish). Feathers are composed by higher concentrations of K, O, S, C and Fe as well as traces of Ti; connective tissues show a remarkably different composition from both the matrix and the fossil feathers, with a much more flat profile and a higher peak of P and Ca, evidencing the underlying calcium phosphatization process. One sample was collected from each region.

