Figure 1.

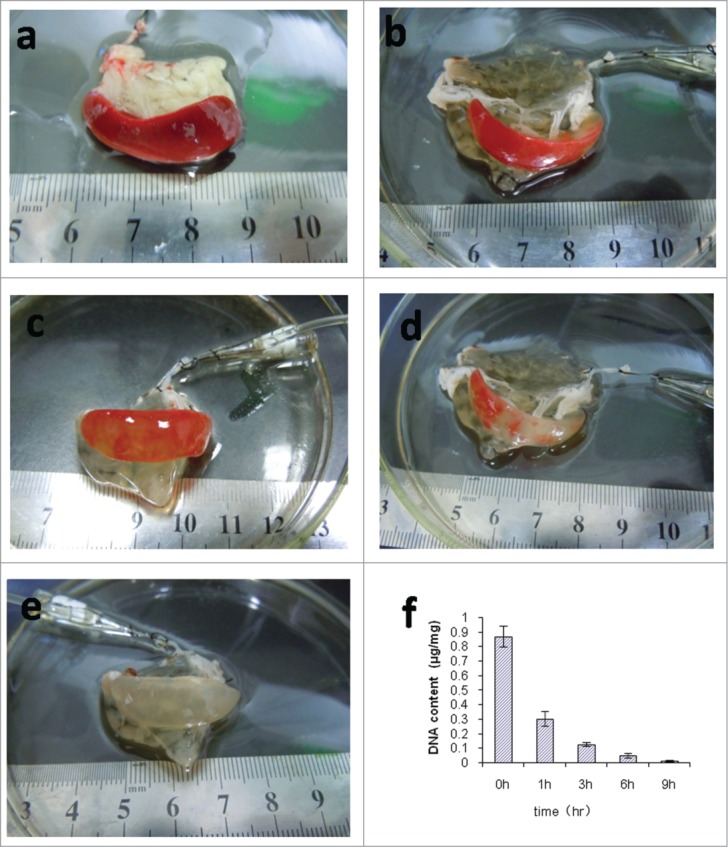
Decellularization of rat spleens. (a–e) Representative images of rat spleen during decellularization process at 0h (a), 1h (b), 3h (c), 6h (d), and 9h (e). (f) Representative the residual DNA content in the decellularized spleen matrix during the different time points.
