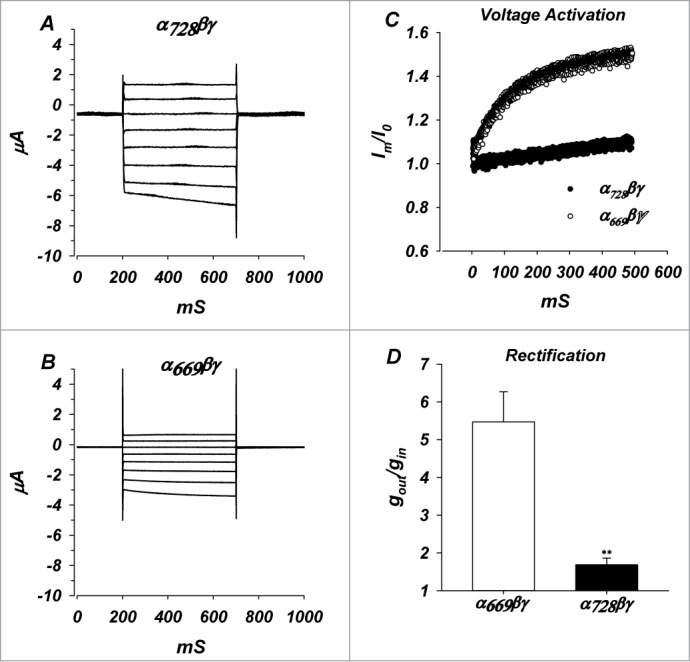
Figure 2.

Whole cell currents, voltage activation and rectification of α728βγ channels. (A) Whole cell currents of α728βγ in the voltage range of −100 to +40 mV. (B) Whole cell currents of α669βγ. (C) Normalized currents at −100 mV, demonstrating voltage activation and differences between the 2 isoforms (n = 6, P < 0.05). Io represents the current immediately after voltage clamping. (D) Comparison of the ratio of outward to inward slope conductances indicating larger inward rectification of α669 channels. n = 11 and 25 for α669 and α728. ** denote P < 0.01.
