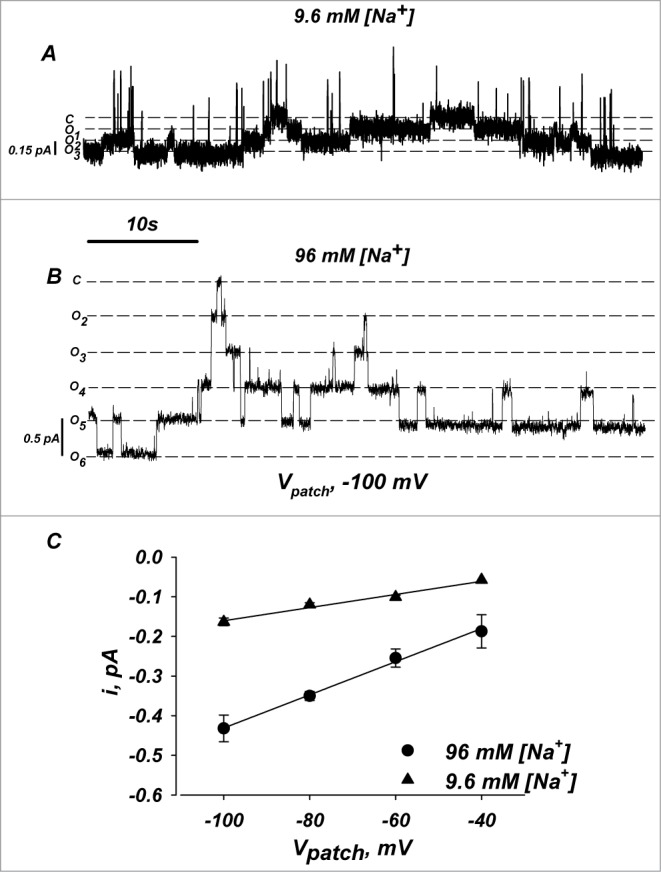
Figure 8.

Single channel conductance and open/close times for α728βγ channels. Single channel recordings were made in cell attached mode. (A and B) Representative current traces of α728βγ at −100 mV under low and high [Na+]. (C) Single channel I/V relationship of α728βγ in low and high [Na+]. Both conductance and kinetics were similar to those observed for α669βγ (not shown, see Thomas et al.7). Oocytes were injected with 5 fold less cRNA to allow channel recordings in stable patches. n = 4.
