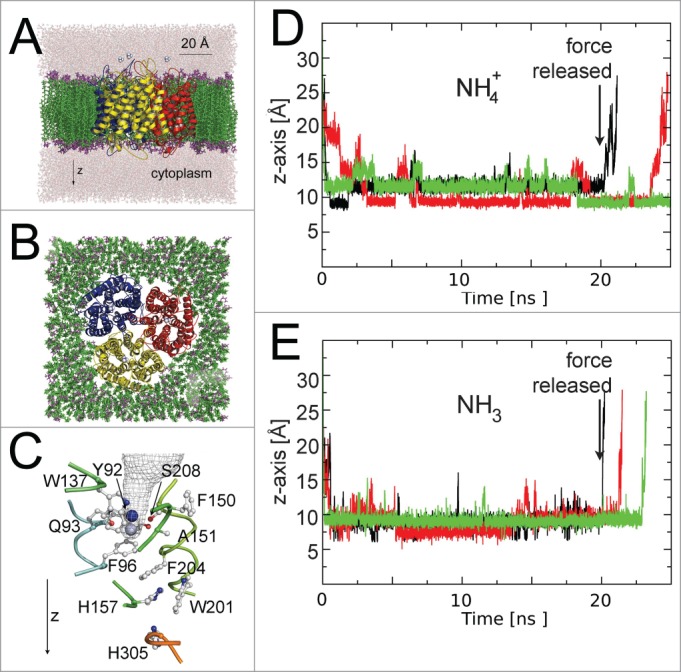
Figure 2.

MD simulations with AfAMT-1. (A) Side view (B) top view of the trimer embedded in lipid membranes. (C) Detail of the pore with 2 preferential residency sites of NH4+ along the z-axis shown in blue and gray. (D and E) Z-axis trajectories of NH4+ (D) and NH3 (E) relative to His 157. Individual trajectories are given in different colors. Note that a steering force was applied to increase the probability of the substrate to enter the external vestibule. The force was released after 20 ns.
