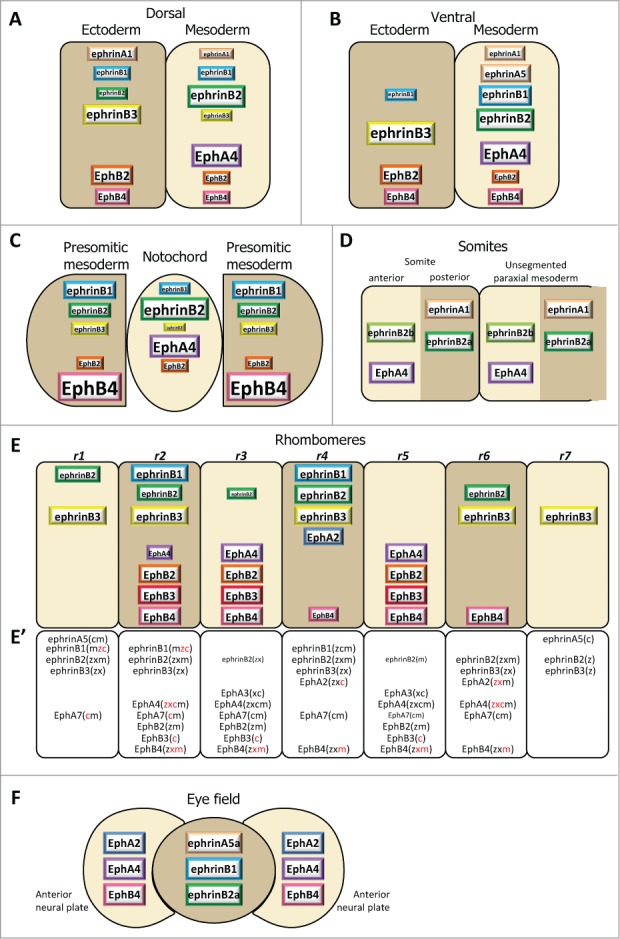
Figure 3.

Ephrin and Eph receptor distribution at vertebrate embryonic boundaries. Each diagram represents the pattern observed in the species where most studies were performed: (A) Dorsal ectoderm-mesoderm boundary in the early Xenopus gastrula. (B) Ventral ectoderm-mesoderm boundary in the middle Xenopus gastrula. (C) Notochord-presomitic boundary in the late Xenopus gastrula. (D) Somitogenesis in zebrafish. (E) Hindbrain segmentation in zebrafish. (E’) Comparative diagram from available data in the 4 species, zebrafish (z), Xenopus (x), chicken (c) and mouse (m). Species abbreviated in black denotes expression, in red absence of (or low) expression in the corresponding segment. Absence of symbol indicates that the gene was not investigated in this species. Note that the ephrinB3 gene is altogether absent from chicken. (F) Eye field segregation in zebrafish. In (A–C), the font and box size represent relative enrichments. Comparative data on expression levels are not available for the other systems, but in a few instances lower expression was clearly observed in the hindbrain (ephrinB2 in r1,r3 and r6, EphA4 in r2, EphB4 in r4). Patterns were built based on expression data from:35,36,38,47 for (A–C), 32,42,48,52,59,122-125 for (D), 33,48,53-56,124,126-128 for (E), and 37 for (F), complemented with the Mouse Gene Expression Databases for zebrafish (http://zfin.org) and mouse (http://www.informatics.jax.org/gxd).
