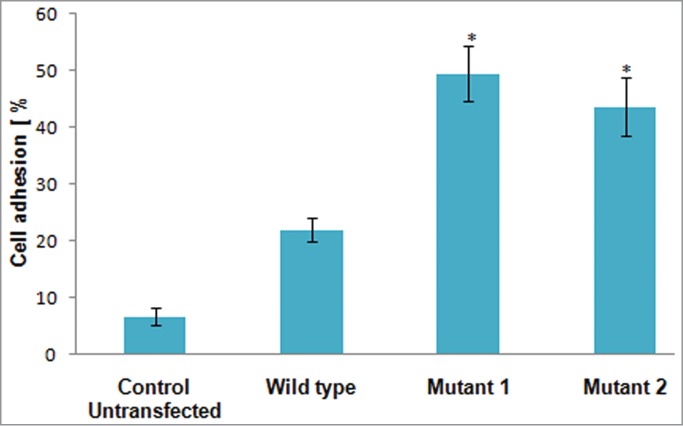
Figure 3.

A bar graph showing % cell adhesion of mutant 1 (N119ACXCR4) and mutant 2 (N119SCXCR4) expressing cells as compared with wildtype CXCR4 expressing cells on fibronectin coated 24-well plate. The results shown represent average of triplicates plus or minus SD (Error bars indicate standard deviation and * indicates P < 0.05 with respect to wild type).
