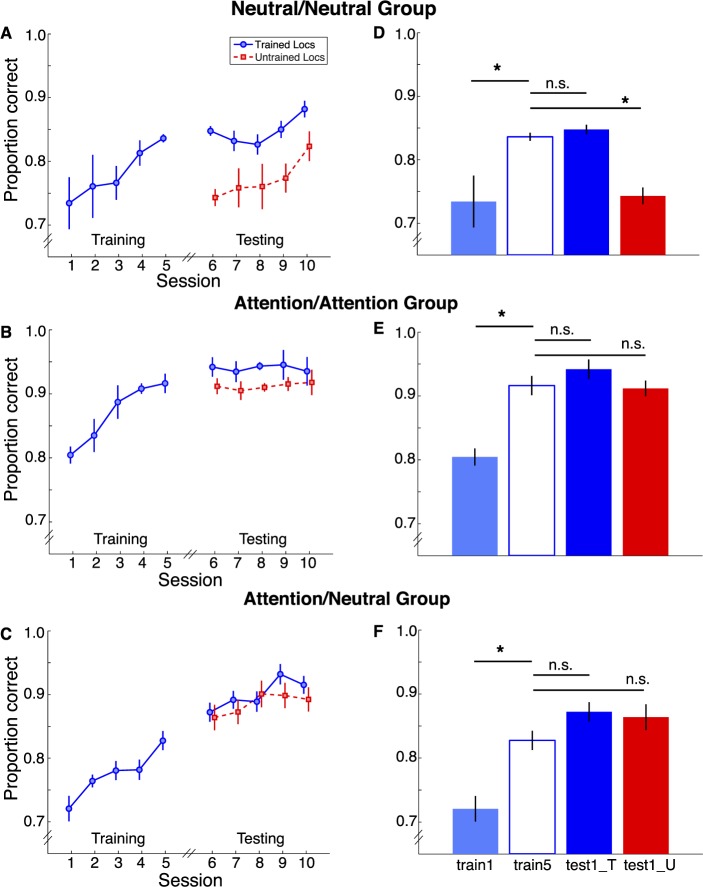
Figure 4.
Results from Experiment 1. Percent correct across all sessions is plotted for the Neutral/Neutral group (A), Attention/Attention group (B), and Attention/Neutral group at the trained locations (blue) and untrained locations (red). Performance on the first day of training (train1, light blue), the fifth day of training (train5, hollow dark blue), the first day of posttraining with stimuli at the trained locations (test1_T, solid dark blue) and at the untrained locations (test1_U, red) are plotted for the Neutral/Neutral (D), Attention/Attention (E), and Attention/Neutral (F) groups.

