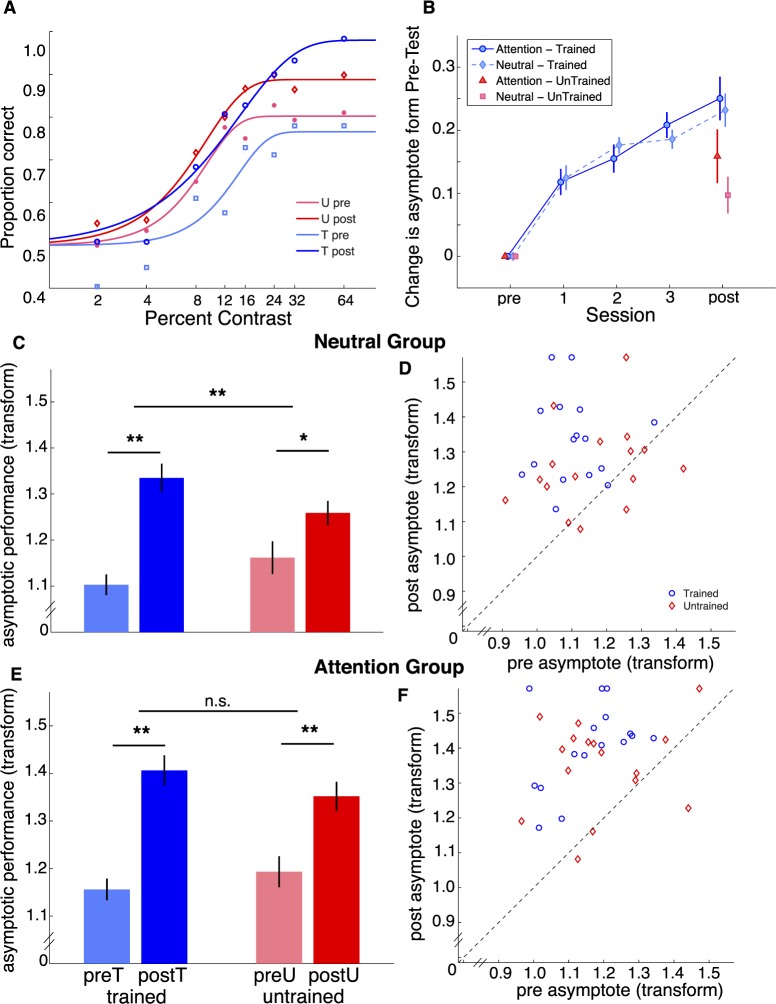
Figure 7.
Results from Experiment 2. (A) Fitted curves to an example observer for pretest at trained (light blue) and untrained (light red) locations, and posttest for trained (dark blue) and untrained (dark red) locations. All other plots show asymptotic performance (1 − λ) after arcsine square root transformation. (B) Mean difference relative to the pretest for the Neutral group (light blue and red) and Attention group (dark blue and red). (C) Values for the pretest and posttest at trained and untrained locations for the Neutral group and (E) Attention group; scatter plots with pretest asymptote on the x-axis and posttest asymptote on the y-axis for the Neutral (D) and Attention (F) groups.

