Figure 1.
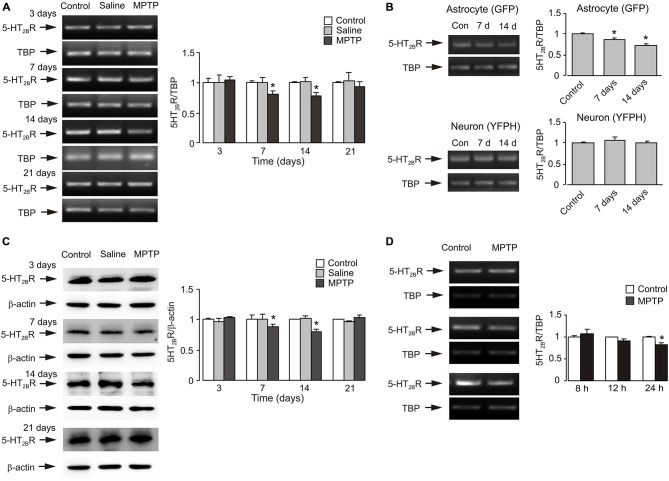
MPTP induced down-regulation of expression of mRNA and protein of 5-HT2B receptor in brain, in astrocytes isolated by FACS from cerebral hemispheres in vivo from mice and in astrocytes in primary cultures. (A) mRNA expression measured by RT-PCR of 5-HT2B receptor in cerebral cortex in vivo from C57BL/6 mice treated with MPTP (25 mg/kg/d, 7 days, i.p.). A representative experiment showing mRNA for 5-HT2B receptor and for TATA BOX-BINDING PROTEIN (TBP), as a housekeeping gene. The size of PCR product of 5-HT2B receptor is 370 bp, and that of TBP 236 bp. Similar results were obtained in six independent experiments. Average mRNA expression was quantified as ratio between 5-HT2B receptor and the housekeeping TBP gene. Ratios between 5-HT2B receptor and TBP in control group were designated a value of one. SEM values are indicated by vertical bars. *Indicates statistically significant (p < 0.05) difference from control and saline group at the same treatment period. (B) mRNA expression measured by RT-PCR of 5-HT2B receptor in astrocytes and neurons isolated by FACS from cerebral hemispheres in vivo from mice (FVB/NTg(GFAP GFP)14Mes/J or B6.Cg-Tg(Thy1-YFPH)2Jrs/J) treated with MPTP (25 mg/kg/d, 7 days, i.p.). A representative experiment showing mRNA for 5-HT2B receptor and for TBP, as a housekeeping gene. Similar results were obtained in three independent experiments. Average mRNA expression was quantified as ratios between 5-HT2B receptor and the housekeeping TBP gene. Ratios between 5-HT2B receptor and TBP in control group were designated a value of one. SEM values are indicated by vertical bars. *Indicates statistically significant (p < 0.05) difference from other groups in the same cell type. (C) Protein expression measured by immunoblotting of 5-HT2B receptor (55 kDa) in cerebral cortex in vivo from C57BL/6 mice treated with MPTP (25 mg/kg/d, 7 days, i.p.). Immunoblots from representative experiments. Bands of 55 and 42 kDa represent 5-HT2B receptor and β-actin, respectively. Similar results were obtained in six independent experiments. Average protein level was quantified as ratios between 5-HT2BR and β-actin. Ratios between 5-HT2B receptor and TBP in control group were designated a value of one. SEM values are indicated by vertical bars. *Indicates statistically significant (p < 0.05) difference from other groups at the same treatment period. (D) mRNA expression of 5-HT2BR in primary cultures of astrocytes. Cells were treated with saline (control) or MPTP (20 μM) for 8, 12 and 24 h. Southern blot from a representative experiment. The size of 5-HT2BR is 370 bp, and TBP 236 bp. (B) Average mRNA expression was quantitated as ratios between 5-HT2BR and TBP. S.E.M. values are indicated by vertical bars, n = 6, *Indicates statistically significant (p < 0.05) difference from other groups at the same treatment period.

