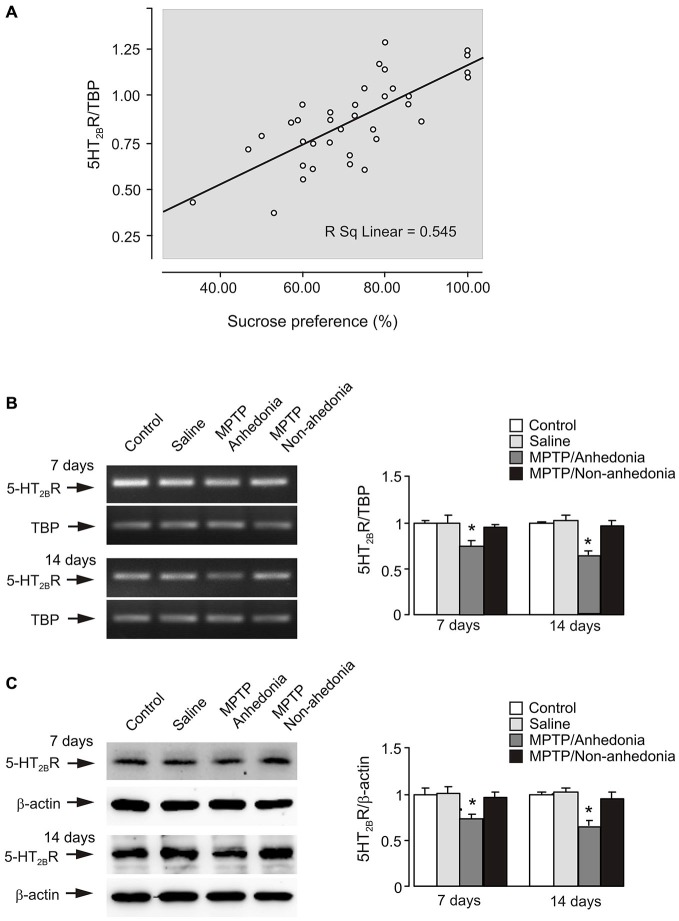
Figure 4.
5-HT2B receptor expression in the brain of anhedonia mice. (A) Correlation analysis between gene expression of 5-HT2B receptor mRNA and the data of behavior test. 5-HT2B receptor expression showed a positive correlation with sucrose consumption (p = 0.000, r = 0.727). P-values were two-tailed, and p < 0.01 was considered significant. (B) mRNA expression measured by RT-PCR of 5-HT2B receptor in cerebral cortex in vivo from anhedonia or non-anhedonia mice. A representative experiment showing mRNA for 5-HT2B receptor and for TBP, as a housekeeping gene. The size of PCR product of 5-HT2B receptor is 370 bp, and that of TBP 236 bp. Similar results were obtained in three independent experiments. Average mRNA expression was quantified as ratios between 5-HT2B receptor and the housekeeping TBP gene. Ratios between 5-HT2B receptor and TBP in control group were designated a value of one. SEM values are indicated by vertical bars. *Indicates statistically significant (p < 0.05) difference from control and saline group at the same treatment period. (C) Protein level measured by immunoblotting of 5-HT2B receptor (55 kDa) in cerebral cortex in vivo from anhedonia or non-anhedonia mice. Immunoblots from representative experiments. Bands of 55 and 42 kDa represent 5-HT2B receptor and β-actin, respectively. Similar results were obtained in three independent experiments. Average protein level was quantified as ratios between 5-HT2BR and β-actin. Ratios between 5-HT2B receptor and β-actin in control group were designated a value of one. SEM values are indicated by vertical bars. *Indicates statistically significant (p < 0.05) difference from other groups at the same treatment period.

