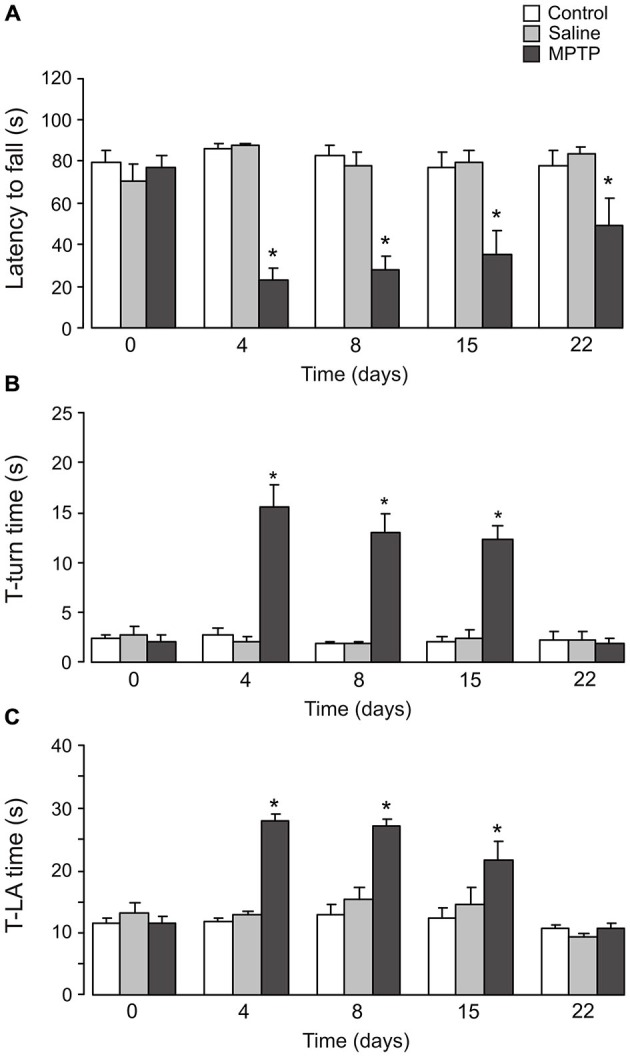
Figure 6.

Effects of MPTP on motor activity. C57BL/6 mice were treated with MPTP (25 mg/kg/d, 7 days, i.p.). Test was done on the 3rd day, 7th day (1 day after the cease of MPTP treatment), 14th day (7 days after the cease of MPTP treatment) and 21th day (14 days after the cease of MPTP treatment). (A) The rotarod test. The latency to fall off the rotarod was recorded. The values are expressed as the mean ± SEM, n = 6, *Indicates statistically significant (p < 0.05) difference from other groups at the same treatment period. (B) T-turn time. The time taken for the mice to turn completely downward in the pole test. The values are expressed as the mean ± SEM, n = 6, *Indicates statistically significant (p < 0.05) difference from other groups at the same treatment period. (C) T-LA time. The time taken for the mice to reach the floor in the pole test. The values are expressed as the mean ± SEM, n = 6, *Indicates statistically significant (p < 0.05) difference from other groups at the same treatment period.
