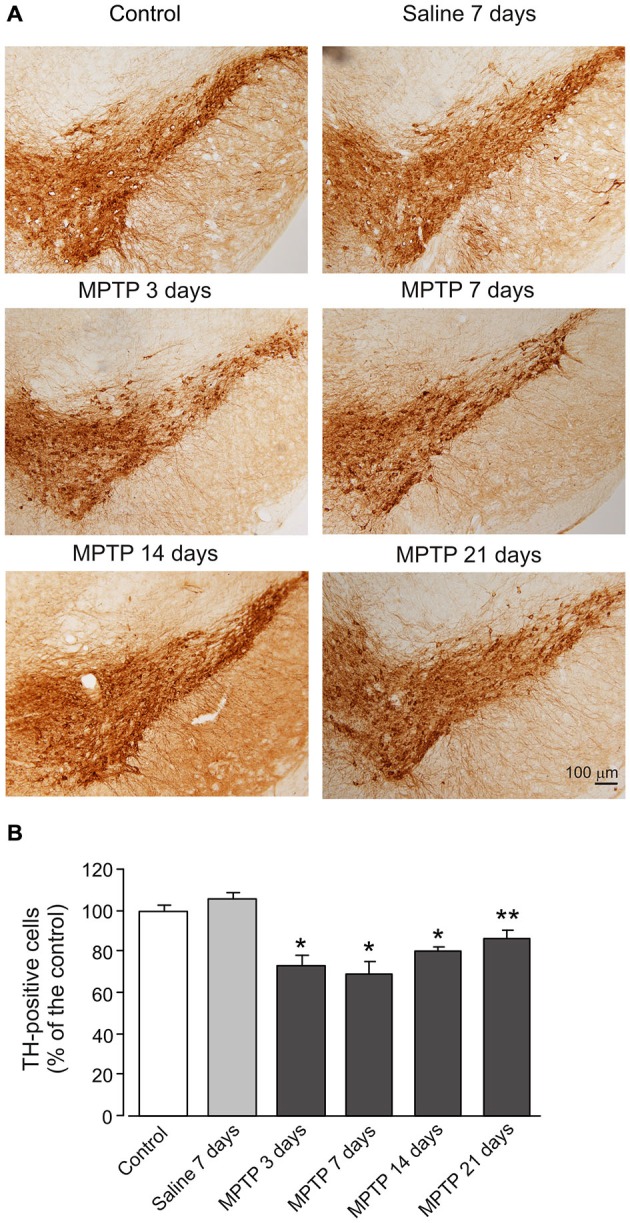
Figure 7.

MPTP induced reduction of TH expression in dopaminergic neurons. (A) Photomicrographs of representative SN sections stained with an antibody against TH. Scale bar = 100 μM. (B) Quantitative analysis of TH-positive neuron numbers in the SN. The values are expressed as the mean ± SEM, n = 7. *Indicates statistically significant (p < 0.05) difference from control and saline groups. **Indicates statistically significant (p < 0.05) difference between control, saline and MPTP 7 days groups.
