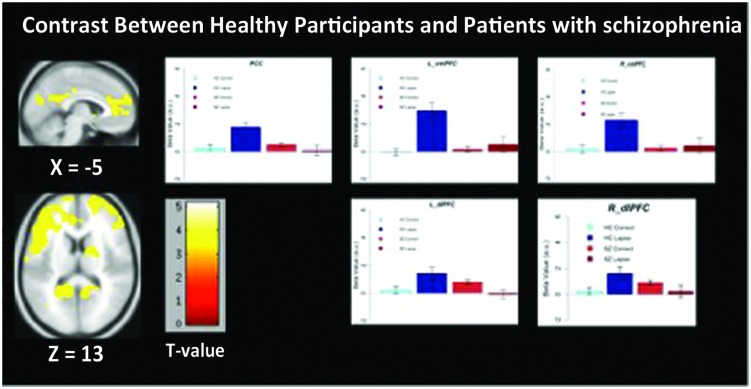
FIGURE 4.
Regions showing significantly greater activation in healthy participants compared to patients with schizophrenia. Beta values for right mPFC, posterior cingulate cortex (PCC), and left dlPFC are shown. Error bars are ±SEM. Scale bar shows t-value for each voxel. Voxel-wise threshold p < 0.01, FWE-corrected at the cluster-level, p < 0.05.

