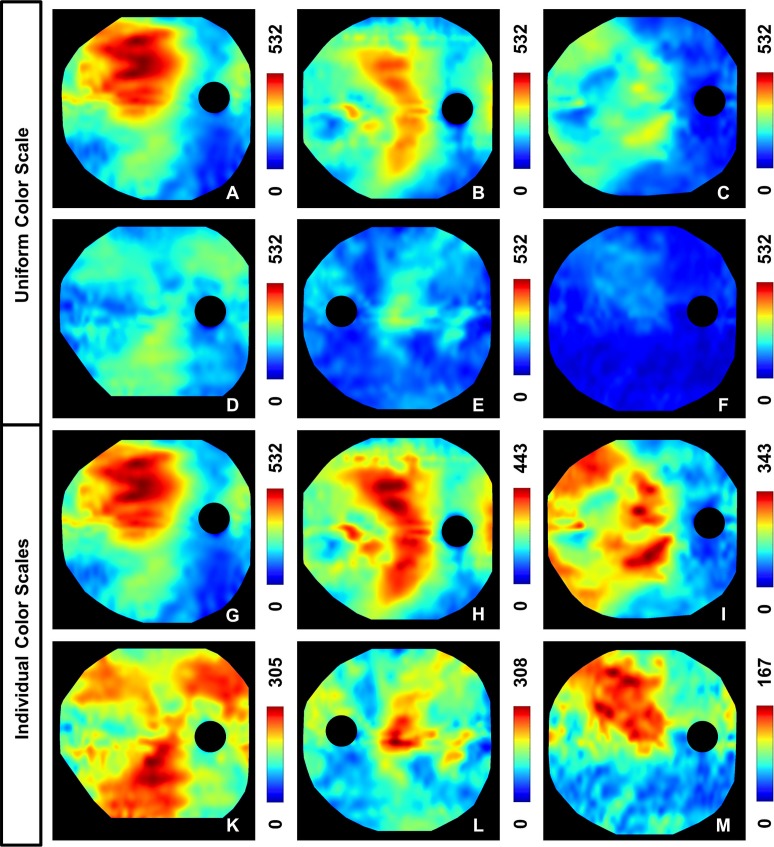
Figure 3.
Choroidal thickness (ChT) maps of six different subjects. (A–F) A uniform color scale is applied on all six subjects to show the high variance in actual ChT; the images are ordered according to decreasing maximum ChT. (G–M) Individually adapted color scales, normalized with respect to the individual maximum ChT, are employed to visualize the symmetric and asymmetric topographic ChT patterns. (A, G) 43-year-old normal male (spherical equivalent refraction [SER] −4.75 D), (B, H) 35-year-old male diagnosed with Graves' orbitopathy and an acute inflammation of the orbit (SER 0 D), (C, I) 31-year-old normal male (SER 0 D), (D, K) 29-year-old female with myopia and equatorial degenerations (SER −8 D), (E, L) 77-year-old female with macular pucker (SER +2.25 D), (F, M) 75-year-old male diagnosed with AMD (SER −0.75 D). All subjects showed thinning inferonasally to the ONH (choroidal thickness was measured in μm).

