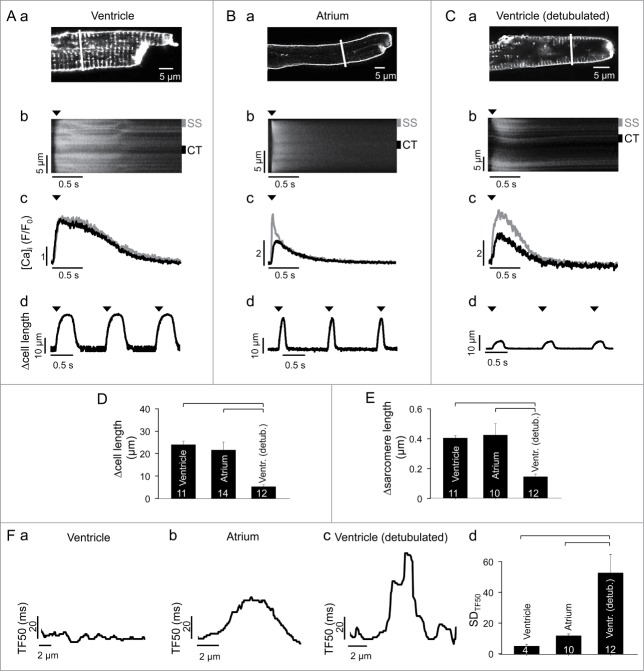
Figure 1.
AP-induced CaTs and cell shortening in intact ventricular, atrial and detubulated ventricular cells. (A, a) membrane and t-tubule staining with WGA-Alexa 594 in a rabbit ventricular myocyte. (b) line scan image of an AP-induced CaT. The confocal line scan image was recorded along the line shown in (a). (c) subcellular CaTs recorded from 1 µm wide susbsarcolemmal (gray; SS in panel b) and central (black; CT in panel b) regions. (d) cell shortening. Arrow heads indicate time of electrical field stimulation. (B, C) same type of data recorded in an atrial (B) and detubulated ventricular (C) myocyte. Detubulation occurred by exposure to 1.5 M formamide. (D, E) average twitch-induced cell shortening (D) and change in sarcomere length (E) in intact ventricular, atrial and detubulated ventricular myocytes. (F) analysis of subcellular synchrony of AP-induced Ca release. (a, b and c) graph of time elapsed between onset of electrical stimulation and the time the local CaT has reached half-maximal amplitude (TF50) along the transverse cell axis in an intact ventricular (a), atrial (b) and detubulated ventricular (c) myocyte. (d) average standard deviation of all local TF50 values (SDTF50) at single pixel resolution across the transverse cell axis for intact ventricular, atrial and detubulated ventricular myocytes. Square brackets indicate significant differences at P < 0.05, one-way ANOVA. Numbers in columns indicate number of cells.

