Figure 4.

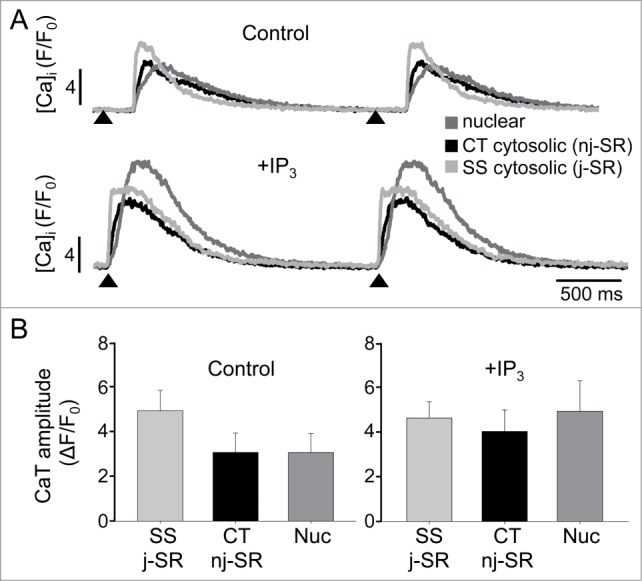
IP3-dependent effects on subcellular CaTs. (A) AP-induced subcellular CaTs under control conditions (top) and after photolysis of caged IP3 (bottom) recorded from 1 µm wide regions of interest. The traces represent subsarcolemmal (SS) cytosolic, central (CT) cytosolic and nuclear changes of [Ca]i. IP3 was uncaged by illumination of the entire cell with 405 nm laser light (2 ms). Arrow heads indicate electrical stimulation. (B) Summary data of averaged subcellular CaT amplitudes under control conditions and after IP3 photolysis (n = 4).
