Figure 3.

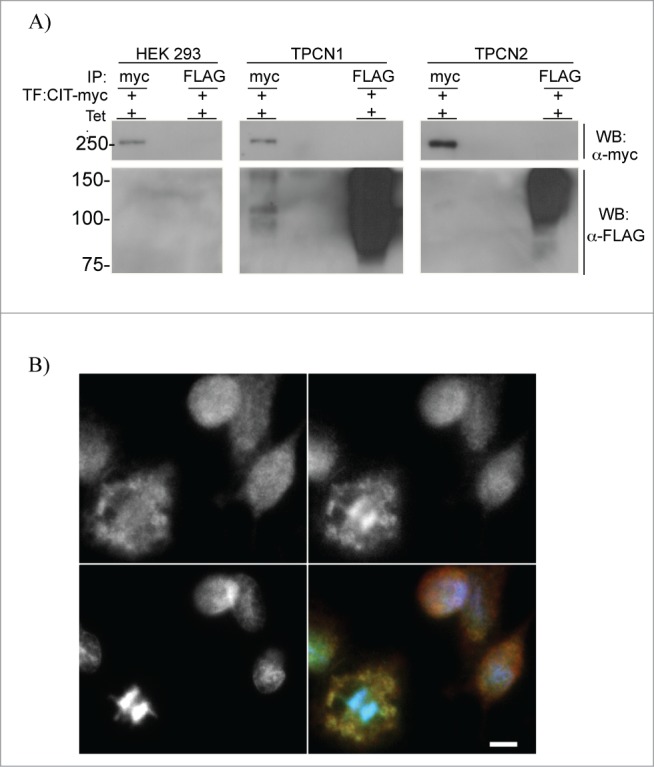
TPC1-CIT interaction and localization. (A) Co-immunoprecipitation of TPC1 and CIT-myc. HEK 293 T-REx, TPC1 and TPC2-overexpressing cells were transiently transfected with pCAG vector containing human CIT-myc. Cells were treated with tetracycline, immunoprecipitated with anti-FLAG or anti-myc antibodies and captured onto protein A agarose beads. Samples were resolved by 10% SDS-PAGE and Western blotted for anti-FLAG or anti-myc reactive proteins. TPC1-FLAG, 94 kDa; TPC2-FLAG, 85 kDa; CIT-myc, 231 kDa. (B) Representative fluorescence microscope image of WT HEK 293 T-REx immunostained for endogenous TPC1 (top left panel, red channel), CIT (top right panel, green channel), DNA (bottom left panel, blue channel), and overlay (bottom right panel). Scale bar = 10 μm.
