Figure 5.

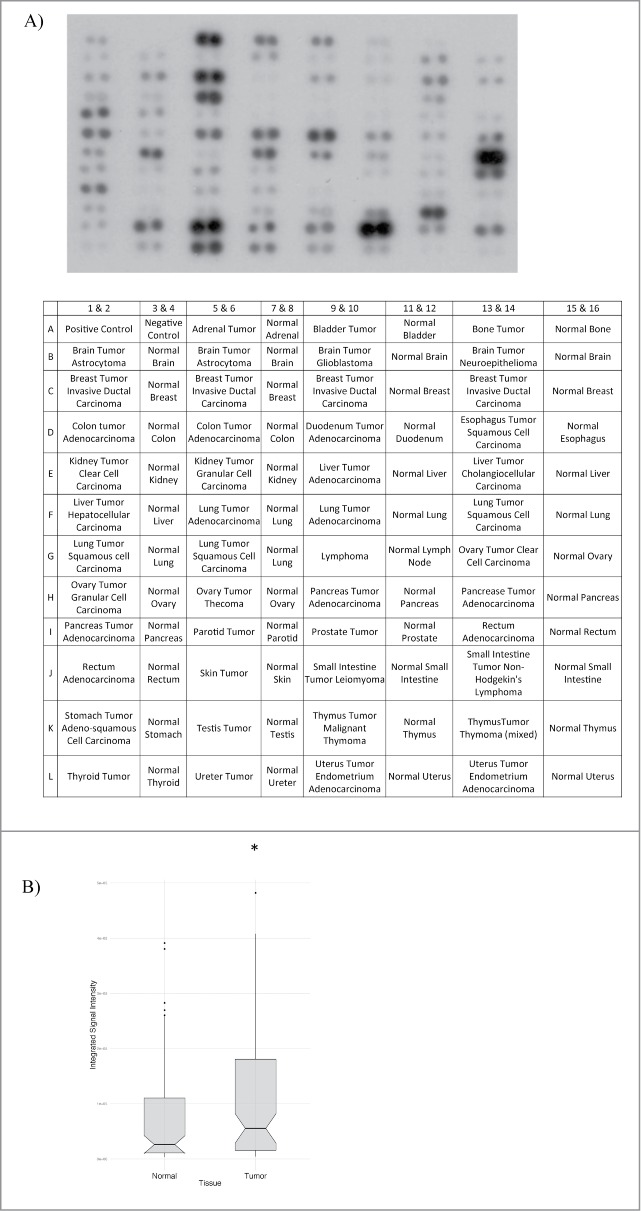
TPC1 expression in human tumor tissue samples. (A) Western blot analysis of TPC1 expression in a human protein array of tumor and normal tissues (Biochain). Protein array was probed with anti-TPC1 (1 ug/ml) and visualized by ECL Plus (GE Healthcare) chemiluminescence detection reagent. (B) Box plots showing the overall range of TPC1 expression in normal vs. tumor tissue. Scores are as follows: top 25% quartiles (top whiskers), middle/median quartile (box), median (notch), bottom 25% quartile (lower whiskers), outliers (dots). P-value = 0.032.
