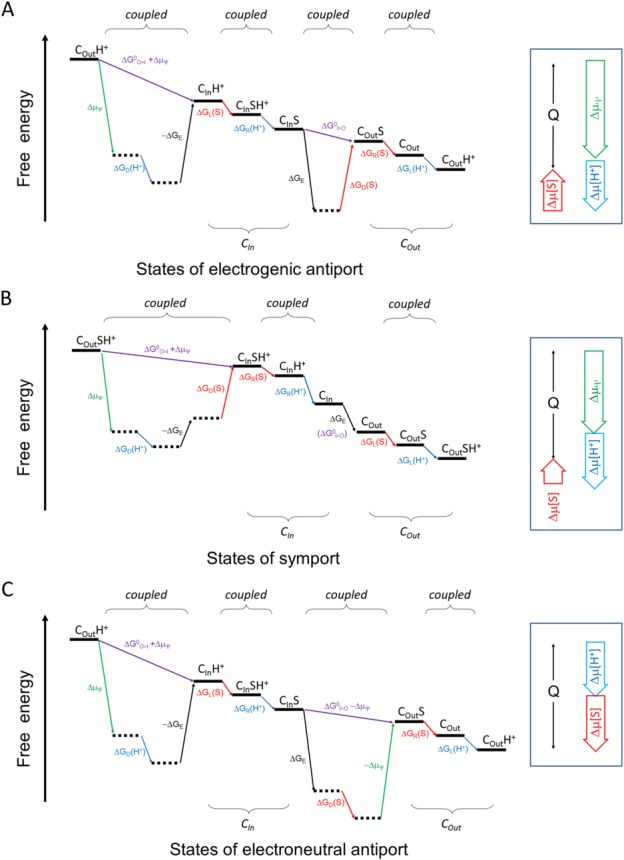
Figure 3.

Schematic diagram of the energy landscape of MFS transporters. A: Electrogenic antiporter. B: Symporter. C: Electroneutral antiporter. The free-energy landscape plot describes the thermodynamic relationship between different states, without attention to kinetic issues. The plot must satisfy the First and Second Laws of thermodynamics. Horizontal lines represent states. Tilted lines represent transitions between states. Transitions associated with the proton are indicated in blue, those with the substrate in red, and those with ΔΨ in green. Subscripts L, R, D, and E stand for energy terms associated with loading, releasing, differential binding, and elastic, respectively. “I>O” and “O>I” stand for the CIn-to-COut and COut-to-CIn conformational changes, respectively. In principle, since the transport process cycles, choice of the starting point is arbitrary. In this sense the starting and ending states are identical, only being differed by the release of heat (Q) during one transport cycle. Thus, the end state must be below the starting state. Neighboring states may be coupled tightly. In such a case, their sequential order may be arbitrary. Locally, any transition of positive ΔG must be driven by a neighboring transition of a negative ΔG. (Also see Appendices).
