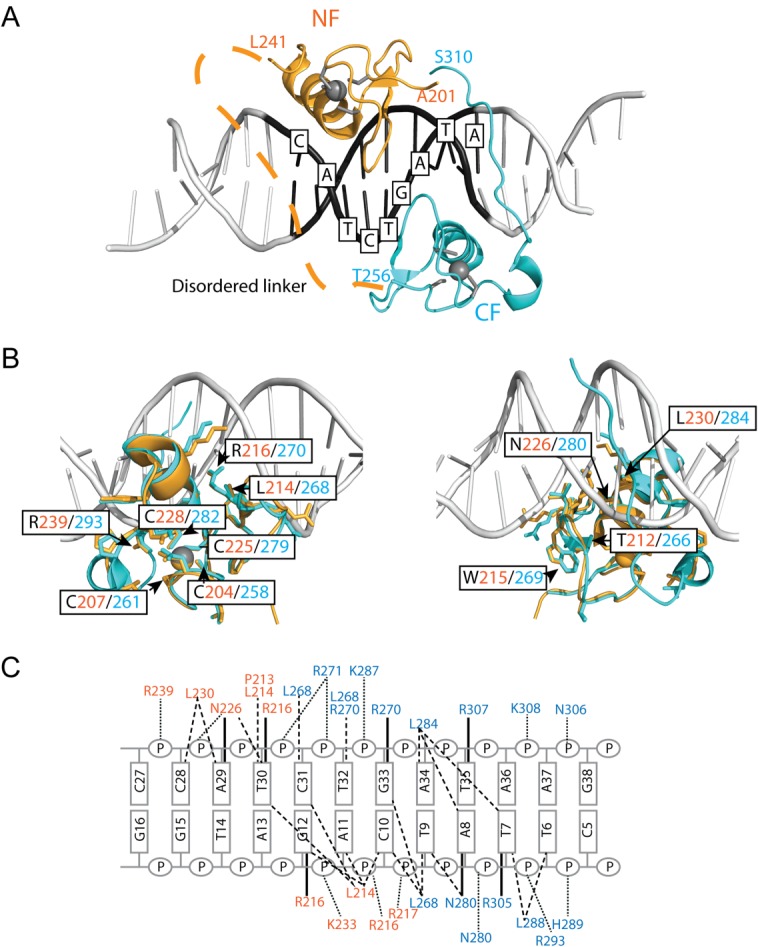
Figure 1.

GATA1NC binds pseudopalindromic DNA in a 1:1 complex. (A) Overall structure of the GATA1NC:mPal Complex (3vd6). Ribbon diagram of GATA1NC bound to an mPal containing oligonucleotide (white and black to indicate the flanking and core mPAL sequence, respectively; the nucleotides in the core sequence are labelled). The NF is shown in orange and the CF is shown in cyan, with the zinc atoms and zinc-ligating sidechains shown as grey spheres and sticks. The linker region between the two fingers was not present in the electron density map and is represented by an orange dashed line. (B) The GATA1NF (orange) aligned with the GATA1CF (cyan) bound to DNA (white) shown from two angles. All residues that are identical in the sequences of the two domains are shown as sticks; residues discussed in the main text are labelled. (C) Schematic of DNA-protein interactions. Orange labels indicate NF and blue labels indicate CF interactions. Bold lines—hydrogen bonds between amino acids and bases; dashed lines—hydrophobic interactions; Dotted lines—contacts with sugar-phosphate backbone. An interactive view is available in the electronic version of the article.
