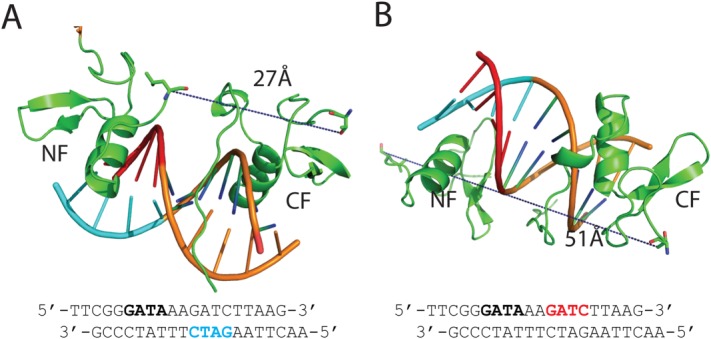
Figure 5.

Model of GATA1NC in complex with GG DNA. (A) Model in which the NF contacts the GATC site (cyan) on the 3′ → 5′ strand. (B) Model in which the NF contacting the GATC site (red) on the 5′ → 3′ strand. The DNA sequence shown with the binding motif indicated. The minimum distances between the ends of the NF and CF are indicated.
