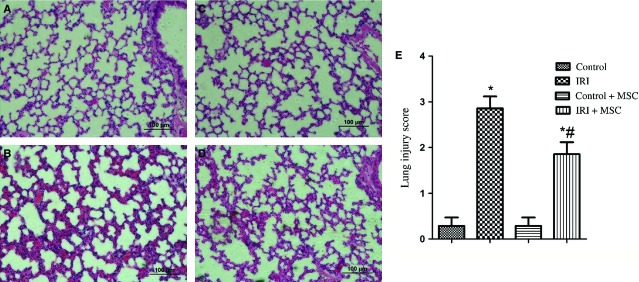
Figure 1.

Lung histology using haematoxylin and eosin staining and the lung injury score (n = 6 for each group). (A) Control group; (B) IRI group; (C) Control+BM-MSCs group; (D) IRI+ BM-MSCs group; (E) Microscopic injury of the left lung was statistically scored. Data are expressed as the mean ± SD. *P < 0.05 versus control group; #P < 0.05 versus IRI group by anova (Bonferroni).
