Figure 2.

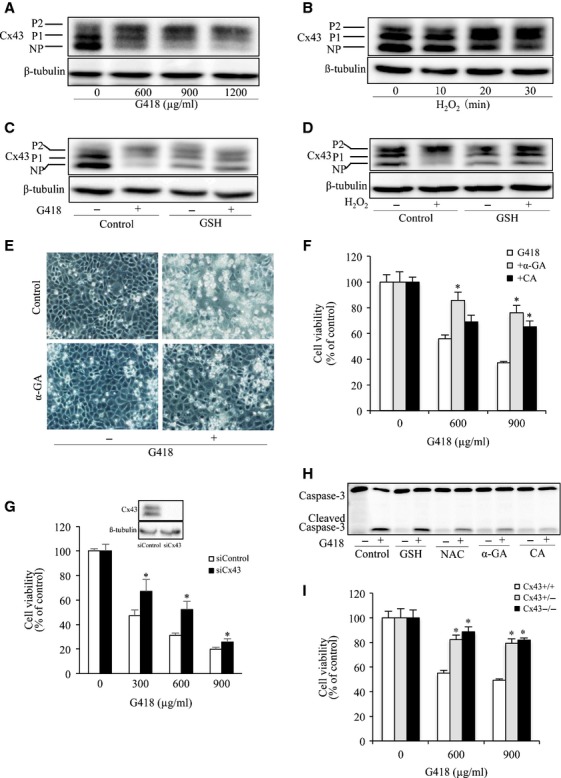
GJs contributed to aminoglycoside-induced NRK-E52 cell injury. (A and B) Influence of G418 and H2O2 on Cx43 expression and phosphorylation. NRK cells were exposed to the indicated concentrations of G418 for 24 hrs (A) or H2O2 for the indicated time intervals (B). Cellular proteins were subjected to Western blot analysis of Cx43 and loading control β-tubulin. NP and P denote non-phosphorylated and phosphorylated Cx43 respectively. (C and D) Effects of GSH on G418- or H2O2-induced Cx43 expression and phosphorylation. Cells were exposing to 600 μg/ml G418 or 50 μM H2O2 in the presence or absence of 5 mM GSH for 24 hrs (C) and 30 min. respectively. Cellular lysates were subjected to Western blot analysis for Cx43. (E) Effects of GJ inhibitor on cell morphology. Cells were exposed to 600 μg/ml G418 with or without 7.5 μM α-GA for 48 hrs. Cell morphology was photographed using phase-contrast microscopy (magnification, ×100). (F) Effects of GJ inhibitors on cell viability. NRK-E52 cells were exposed to the indicated concentrations of G418 in the presence or absence of 7.5 μM α-GA or 10 μM CA for 48 hrs. The cell viability was evaluated by CCK-8 assay. Data are expressed as percentage of living cells against the untreated control (mean ± SE, n = 4; *P < 0.05). (G) Effect of Cx43 siRNA on G418-induced cell injury. Cells transfected with Cx43 siRNA or control siRNA were exposed to the indicated concentrations of G418 for 72 hrs. Then the cellular viability was evaluated through CCK-8 assay. Data are expressed as percentage of living cells, compared with the siRNA control (mean ± SD, n = 4; *P < 0.05 versus siRNA control). (H) Effects of antioxidants and GJ inhibitors on G418-induced activation of caspase-3. Cells were pre-treated with 5 mM GSH, 10 mM NAC, 7.5 μM α-GA or 10 μM CA for 1 hr before exposing to 600 μg/ml G418 for an additional 24 hrs. Cellular lysates were subjected to Western blot analysis for caspase-3. The top band represents procaspase-3 (M.W. 35,000) and the bottom band indicates its cleaved, mature form (M.W. 17,000). (I) Effects of G418 on cell viability in foetal fibroblast cells. C43+/+, Cx43+/− and Cx43−/− fibroblasts were incubated with indicated concentrations of G418 for 24 hrs. The cell viability was evaluated by CCK-8 assay. Data are expressed as percentage of living cells against the untreated control (mean ± SD, n = 4; *P < 0.05 versus G418 alone).
