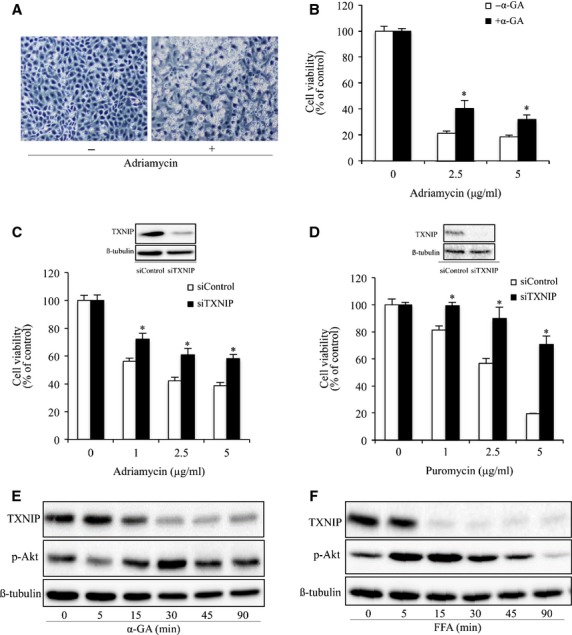
Figure 6.

Cx43/TXNIP/Akt signalling cascade regulates cell response to puromycin and adriamycin. (A) Induction of NRK-E52 cell shape change by adriamycin. NRK-E52 cells were exposed to adriamycin (1 μg/ml) for 24 hrs. Cell morphology was photographed using phase-contrast microscopy (magnification, ×100). (B) Effect of GJ inhibitor on adriamycin-induced loss of cell viability. NRK cells were exposed to the indicated concentrations of adriamycin in the presence or absence of 7.5 μM α-GA for 20 hrs. The cell viability was evaluated by CCK-8 assay. Data are expressed as percentage of living cells against the untreated control (mean ± SD, n = 4). *P < 0.05 versus adriamycin alone. (C) Effects of TXNIP siRNA on adriamycin-induced cell injury. NRK-E52 cells were transfected with either TXNIP siRNA or control siRNA for 24 hrs. The transfected cells were incubated with the indicated concentrations of adriamycin for 30 hrs. The cellular viability was evaluated through CCK-8 assay. Data are expressed as percentage of living cells, compared with the siRNA control (mean ± SD, n = 4; *P < 0.05 versus siRNA control). (D) Effects of TXNIP siRNA on puromycin-induced cell injury. Cells were transfected with either TXNIP siRNA or control siRNA for 24 hrs. The transfected cells were incubated with indicated various concentrations of puromycin for 30 hrs. The cellular viability was evaluated through CCK-8 assay. Data are expressed as percentage of living cells, compared with the siRNA control (mean ± SE, n = 4; *P < 0.05 versus siRNA control). (E) Effects of GJ inhibitors on Akt phosphorylation and TXNIP in podocytes. Podocytes were treated with 7.5 μM α-GA or 50 μM FFA for the indicated time intervals. Cellular lysate were subjected to Western blot analysis of phosphorylated Akt and TXNIP. Equal loading of protein per lane was verified by reprobing the blots with an anti-β-tubulin antibody.
